
S&P 500 Down 10% Into Early September?
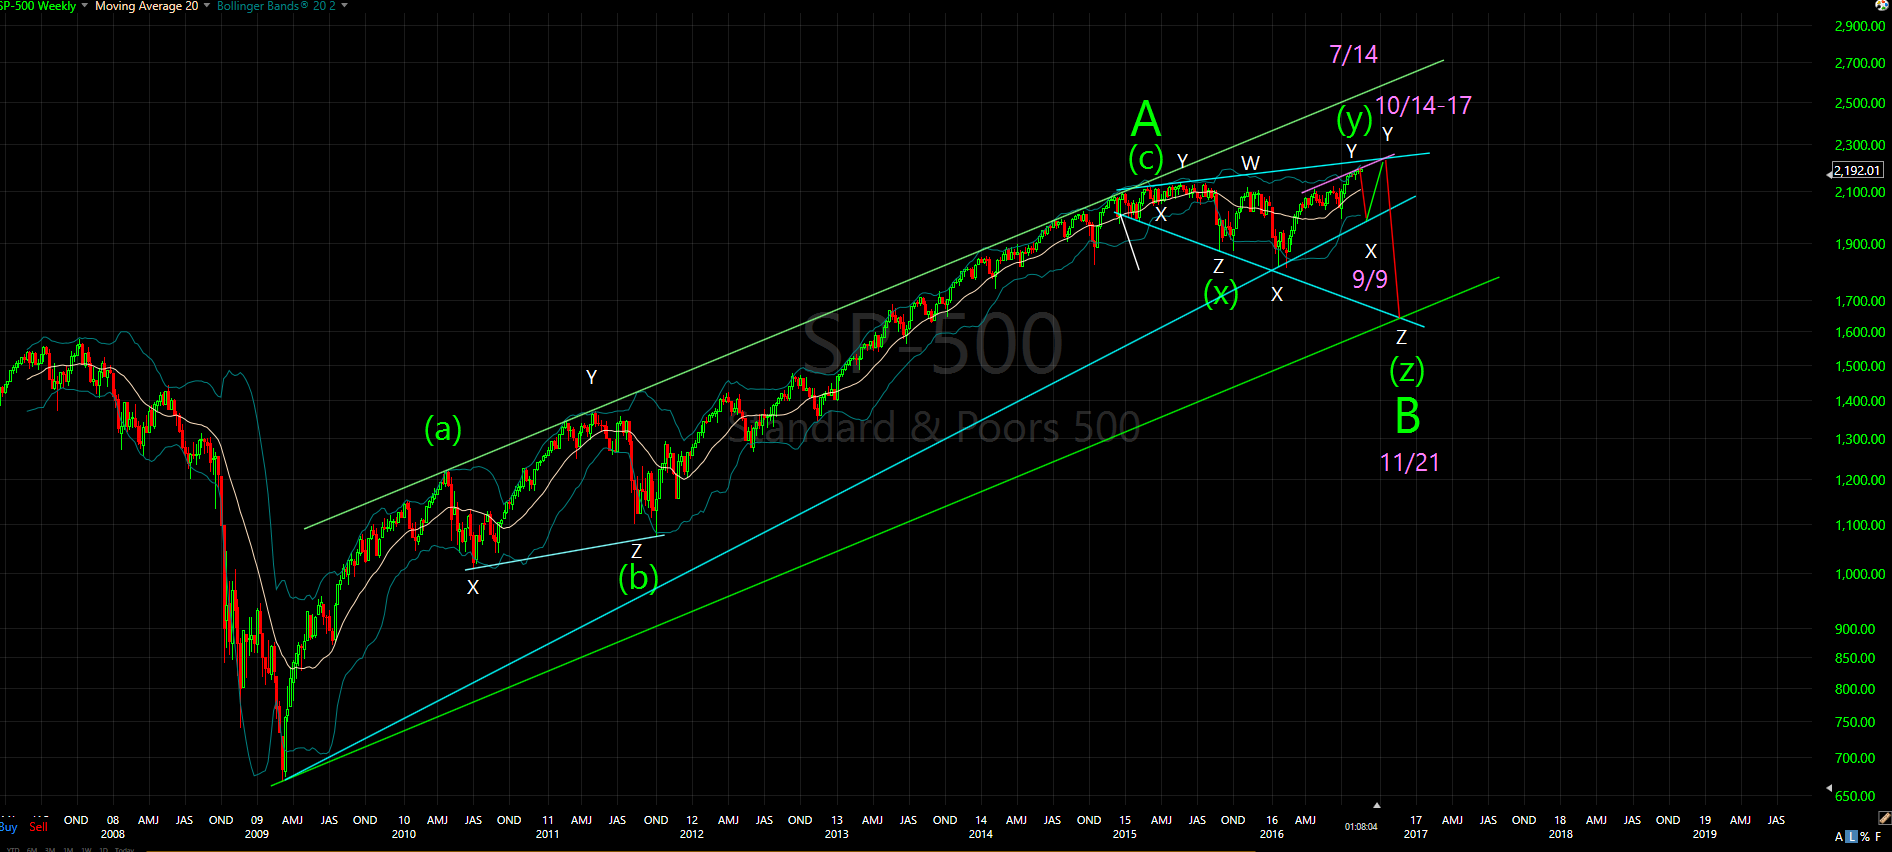
The chart below shows the weekly SPX since late 2008 to the current. According to my calculations, Wave Y of a WXY “Y” of B WAVE terminated at 2168/69 on July 14. Everything after that has been irregular and part of wave X of “Z” into November 21. Wave X is being subdivided xyz and y of that wave terminated today at 2193/94.
My down side target is near 1970 by Sept 9, with the big wave down “c”of Z from the solar/new moon eclipse top of Sept 1 to the expected ten week low of September 9. After that, a new high around October 17 near 2241 and then down into the November 21 expected low near 1638.
The way things are setting up, we might expect the hardest part of the down wave to occur from November 8 to 21, just after the election!
This coming week looks choppy and down, with a rally on Thursday, but possibly down hard on OPEX. The 2130’s look attainable by Friday.
Disclaimer: The information provided by the BluStar Market Timer is to be used for educational purposes only. We do not recommend the buying or selling of any securities, are not registered ...
more


Now I'm thinking more like 6.9% into Sept 1 from the top on August 15 with another move up to the 2221/22 SPX area by Sept 20. A crash into November still looks likely to me. We could see a mini panic from August 30-Sept 1 of 6.6%.
Thanks for sharing