
S&P 500: Consolidation Is Likely Near-Term
- SPX Monitoring purposes; Sold 10/25/17 at 2557.15=breakeven; long SPX 10/16/17 at 2557.64.
- Monitoring purposes Gold: Covered short GDX at 23.23 on 10/20/17 =gain 2.56%; Short GDX on 10/13/17 at 23.84.
- Long Term Trend monitor purposes: Neutral.
(Click on image to enlarge
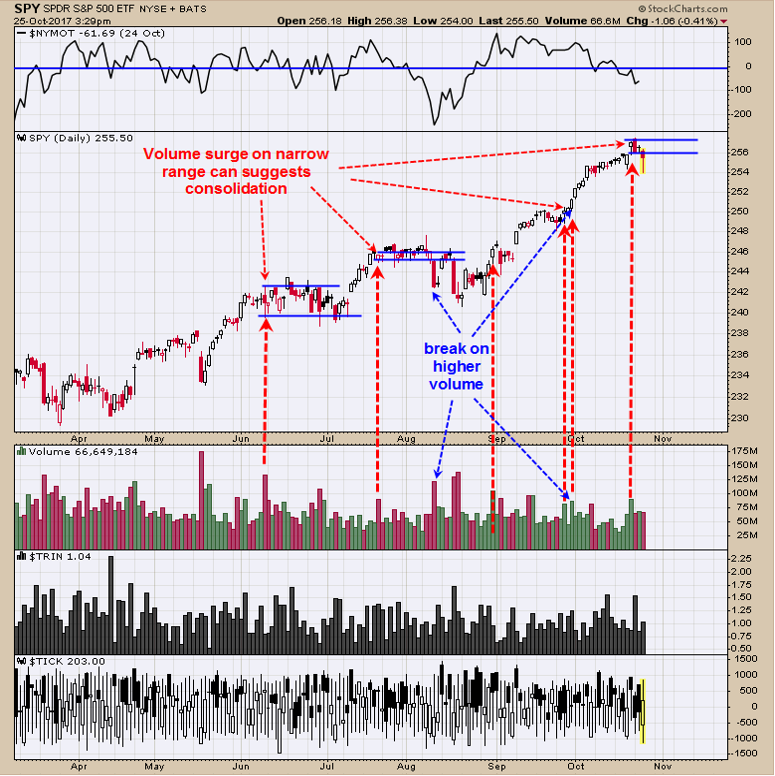
On Monday the Tick closed at -347 and the TRIN at 1.56 which is a bullish combination and can suggest the rally will continue or start a sideways consolidation but rarely a top. There is evidence that a consolidation is likely near-term. The chart above-identified with red arrows shows narrow range days with a volume surge. These narrow high volume days suggests short-term exhaustion for the market. If the narrow high volume day is exceeded on even higher volume (which happen in late September) than trend can continue and if tested on lighter volume than expect a resistance. The testing of the narrow range high volume low works the same way. We noticed that today’s volume was higher than the previous low and suggests at some point today’s low will be tested again. A sideways market probably has started and can last into Thanksgiving after which the rally may resume. Sold long SPX on 10/25/17 at 2557.15=breakeven. Long SPX on 10/6/17 at 2557.64.
(Click on image to enlarge)
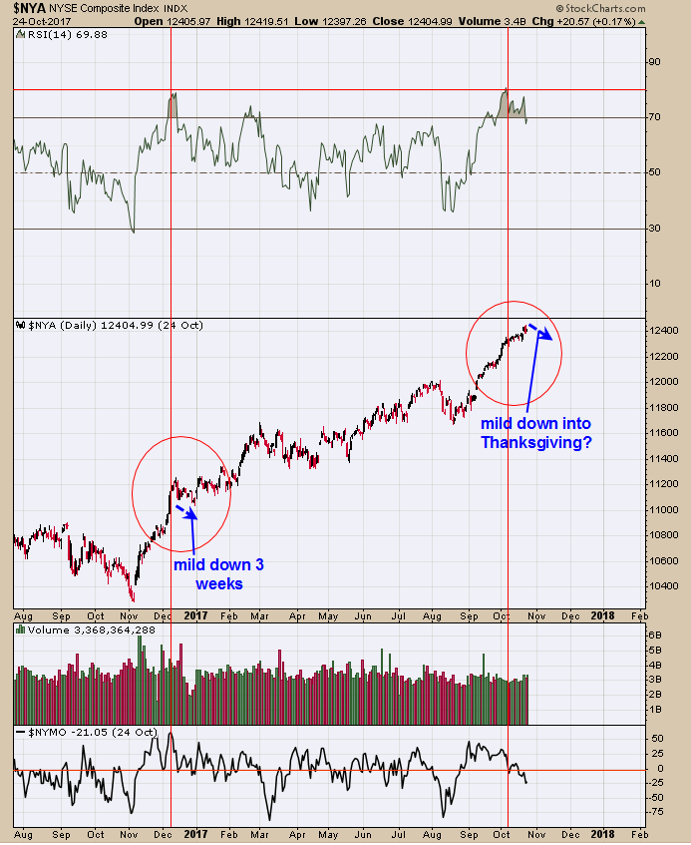
Above is the NYSE chart going back to 2016’s and shows the last times when the RSI reached 80 which was December 13, 2016 and October 5, 2017.It rare for the RSI to reach 80 and when it does, it suggests market has much further to go longer term but can stall short term.Market tops don’t form when the RSI reaches 80 but consolidation can occur. We were concluding at one point that the market may stagger higher into the Thanksgiving holiday. But with the volume surge last Friday the market may stagger lower into Thanksgiving. Its also common that tops and bottoms form around holiday is making Thanksgiving an important timeframe.
(Click on image to enlarge)
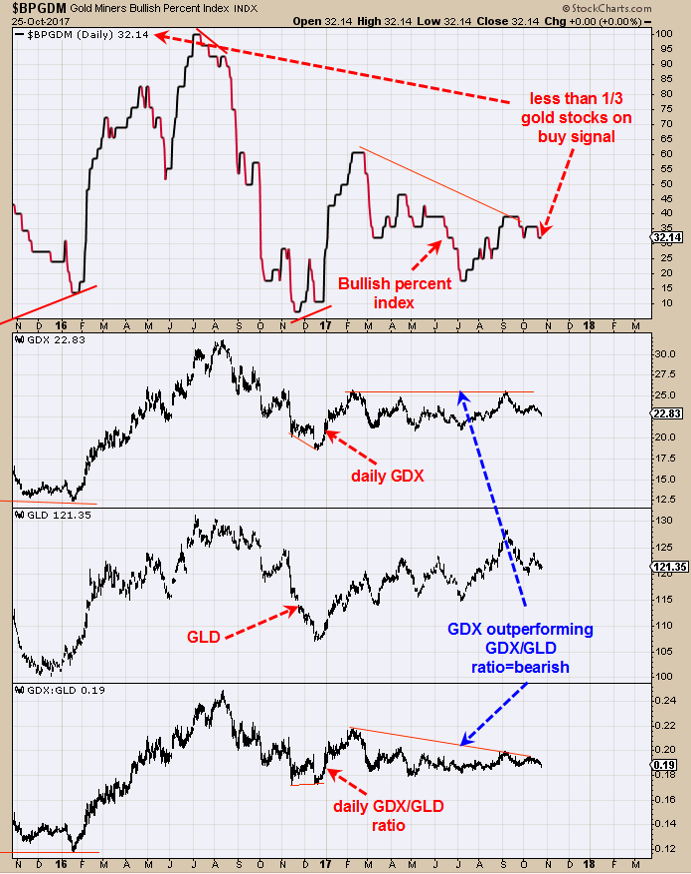
There is a cycle low due around December (+ or – a month). The chart above suggests in general that the gold stocks should move lower into that cycle low. The bottom window is the Bullish percent index for the Gold miners index which shows that 32.14 (less than a 1/3 of gold stocks) that are on point and figure buy signals and not a strong showing. Since early 2017, GDX matched its February higher where GDX/GLD ratio fell short, showing GDX is outperforming GDX/GLD ratio. In bull moves for gold and gold stocks the GDX/GLD ratio outperforms GDX. After the next major low we should see GDX/GLD ratio showing strength against GDX and see the Bullish Percent index jump to 60% or higher. As for now in general the trend is down to a possible low in December. Covered short GDX on 10/20/17 at 23.23 = gain 2.56%; Short GDX 10/13/17 at 23.84.
Disclaimer: Signals are provided as general information only and are not investment recommendations. You are responsible for your own investment decisions. Past performance does not guarantee future ...
more

