
S&P 500 Below 2,800 Again, New Downtrend Or Just Correction?
The U.S. stock market indexes lost 0.7-1.7% on Friday, as investors took short-term profits off the table following the recent rally. The S&P 500 index got back below the level of 2,800. The index was 11.5% below September the 21st record high of 2,940.91 on Monday two weeks ago. And now it trades 5.5% below the all-time high. The Dow Jones Industrial Average lost 0.8% and the Nasdaq Composite lost 1.7% on Friday.
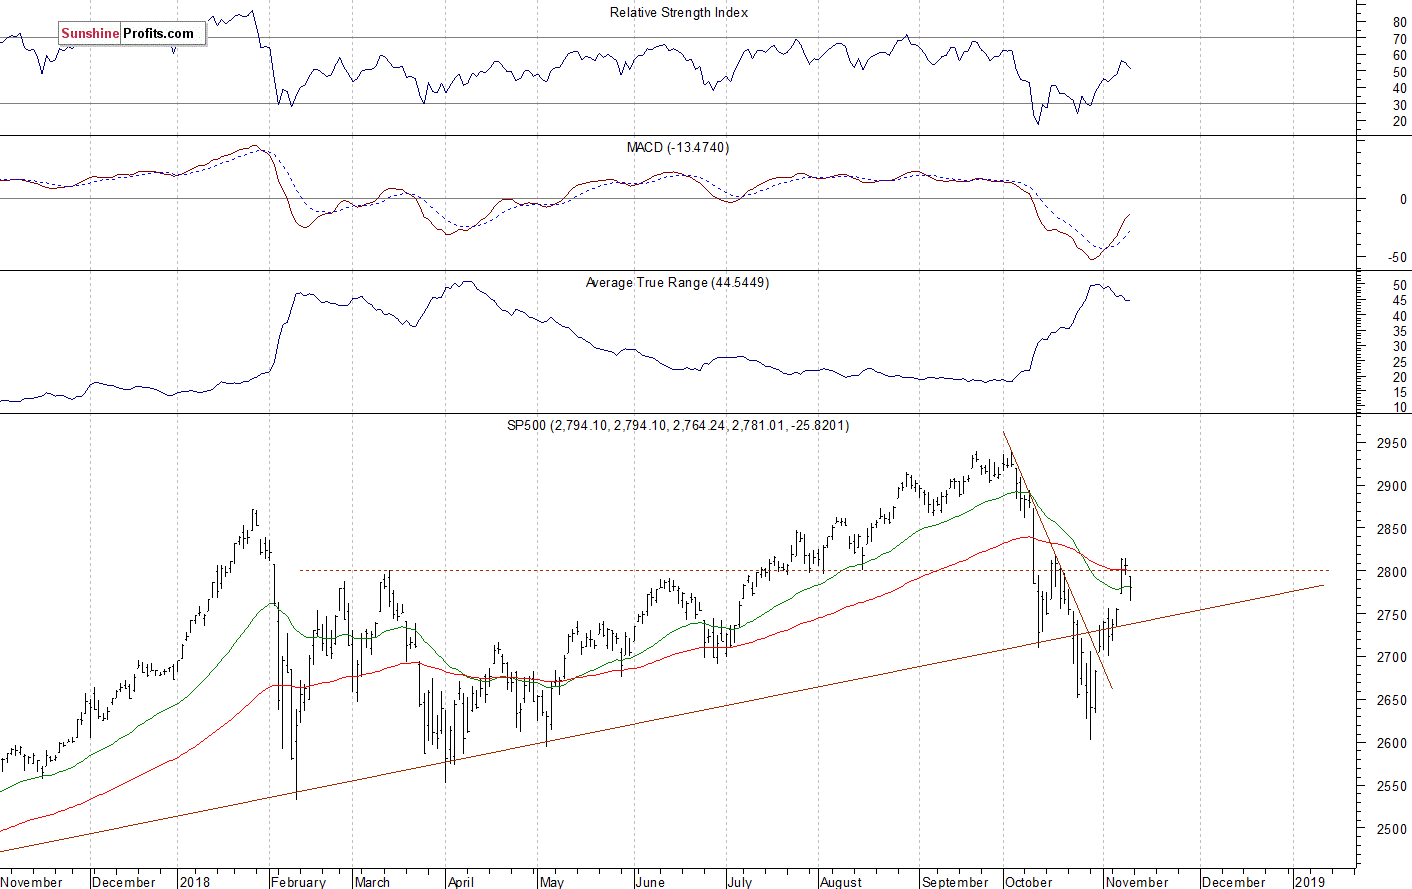
The nearest important level of resistance of the S&P 500 index is now at around 2,795, marked by Friday's daily gap down of 2,794.10-2,794.99. The next resistance level is at 2,815-2,820, marked by mid-October local high of 2,816.94. The resistance level is also at 2,860-2,865, marked by the previous local lows. On the other hand, the support level is at 2,755-2,775, marked by last week's Wednesday's daily gap up of 2,756.82-2,774.13 and Friday's daily low.
The broad stock market extended its downtrend around two weeks ago, as the S&P 500 index fell closer to 2,600 mark. Then it bounced sharply and accelerated higher. On Wednesday we wrote that if the index breaks above 2,750, we could see more buying pressure. And the market got back above the broken long-term upward trend line. It was also back above 2,800 mark again. However, the index bounced off its mid-October local high. Will it resume the uptrend? Or was it just a correction before another leg down? The index is above its long-term upward trend line again:
Below 2,800 Mark
Expectations before the opening of today's trading session are virtually flat, because the index futures contracts trade between -0.1% and +0.2% vs. their Friday's closing prices. The European stock market indexes have lost 0.2-0.9% so far. There will be no new important economic data announcements today. The broad stock market will likely fluctuate below the level of 2,800 today. The market retraced some of its recent rally, however, there have been no confirmed negative signals so far.
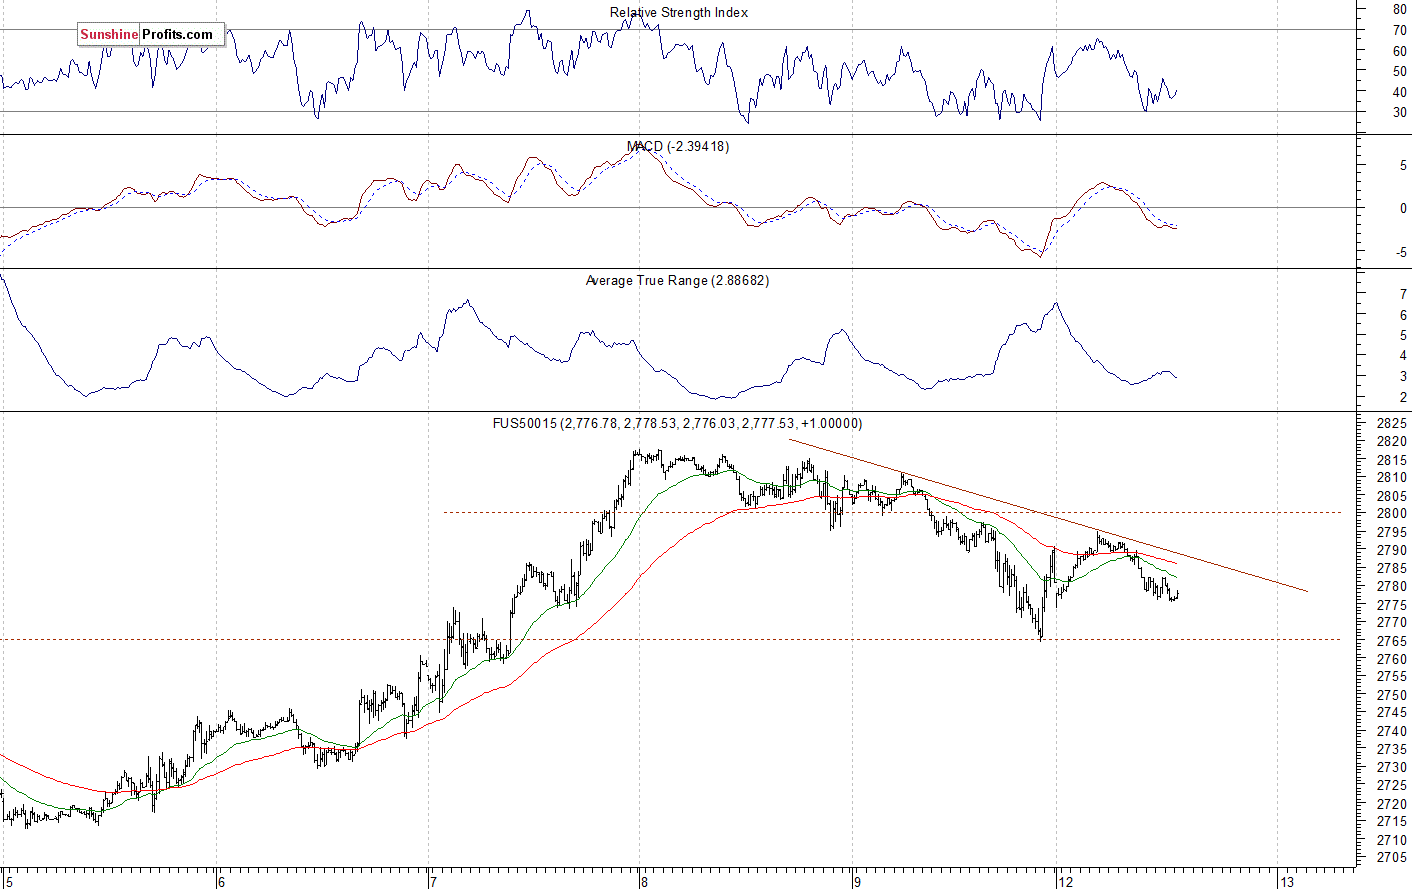
The S&P 500 futures contract trades within an intraday downtrend, as it retraces its overnight advance. The nearest important level of resistance is at around 2,790-2,795, marked by the short-term local high. The next resistance level is at 2,800. On the other hand, the support level is at 2,765-2,770, marked by the local low. The futures contract remains below the level of 2,800, as we can see on the 15-minute chart:
Nasdaq Also Lower
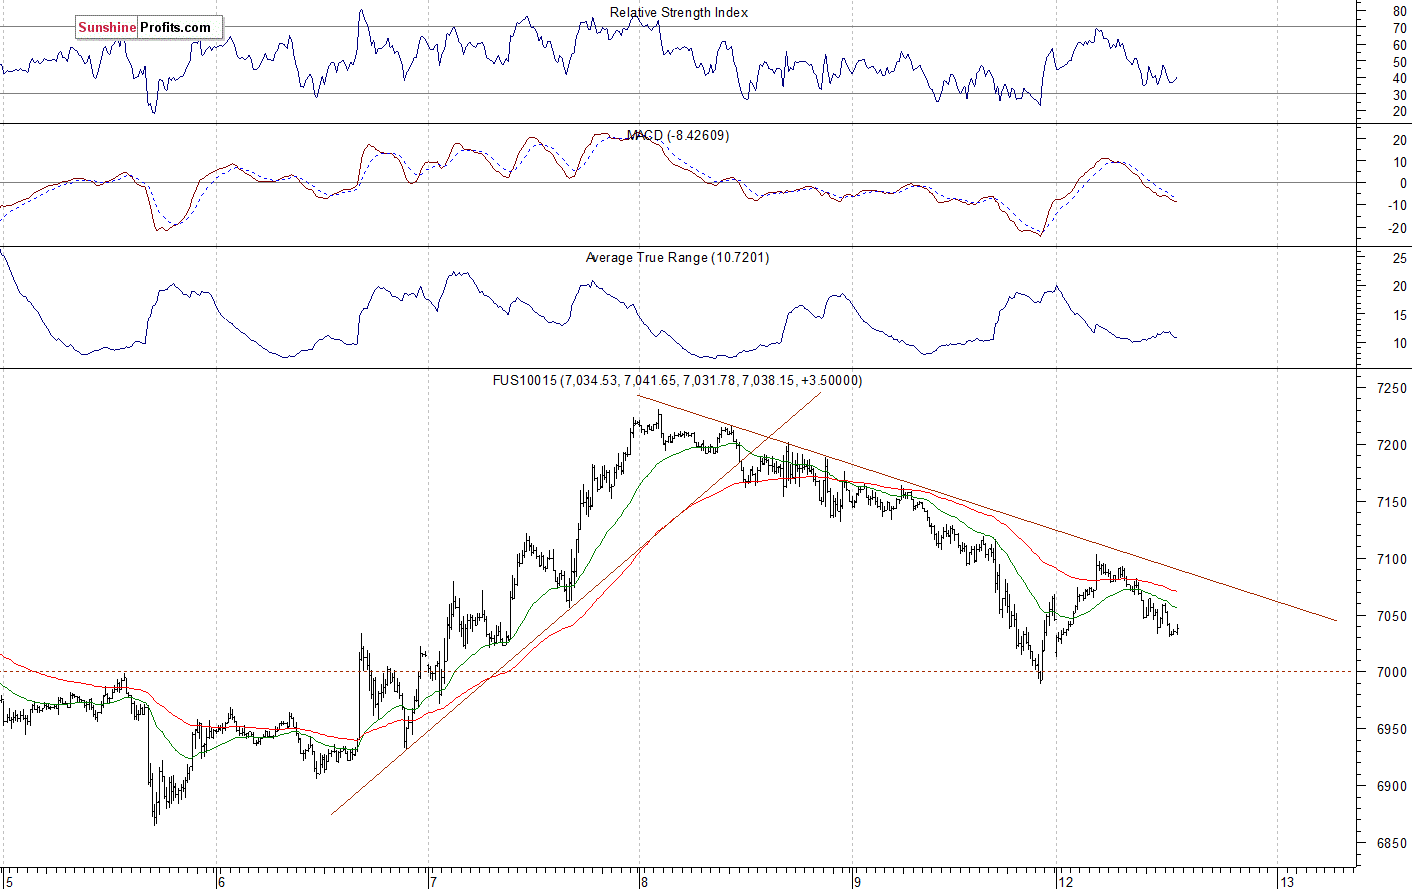
The technology Nasdaq 100 futures contract follows a similar path, as it retraces its overnight advance. The market retraced more of its recent rally on Friday, after bouncing off the resistance level of around 7,200-7,250. On the other hand, the support level is at around 6,950-7,000. The next support level is at 6,900, among others. The Nasdaq futures contract trades below its short-term downward trend line, as the 15-minute chart shows:
Apple, Amazon - Mixed Picture, Not Bullish Yet
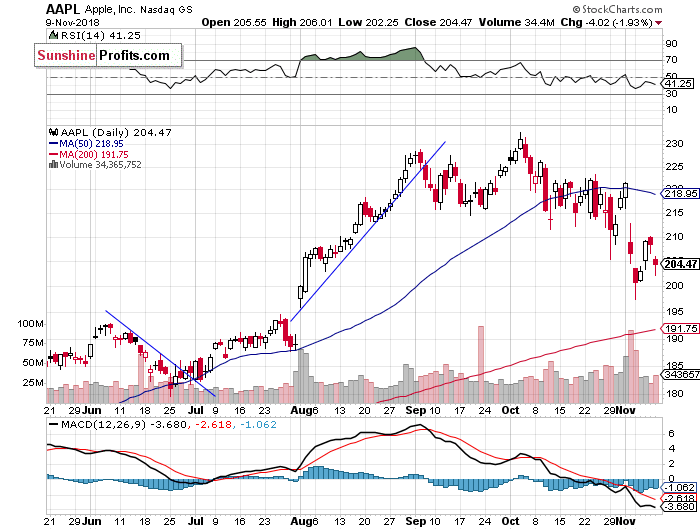
Let's take a look at Apple, Inc. stock (AAPL) daily chart (chart courtesy of StockCharts). It sold off below the level of $200 a week ago, before bouncing off the support level. It was relatively weaker than the broad stock market, as investors continued to react to the quarterly earnings release. The stock fell the lowest since the early August. On Wednesday the market got back to the broken support level of around $210-215. However, it fell lower again on Friday. For now, it looks like an upward correction before another leg lower:
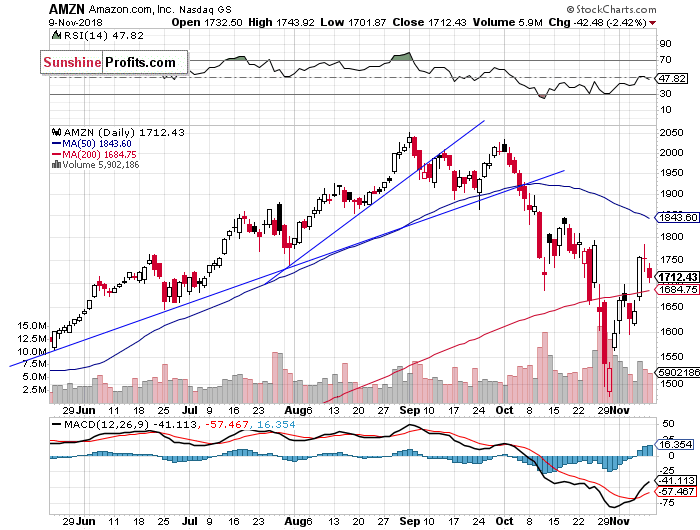
Now let's take a look at Amazon.com, Inc. stock (AMZN) daily chart. It accelerated its sell-off following quarterly earnings release. The stock continued lower recently, but then it bounced off the support level of $1,500. It accelerated higher on Wednesday, however, the price reached a potential resistance level of around $1,750-1,800:
Dow Jones Still Close to 26,000 Mark
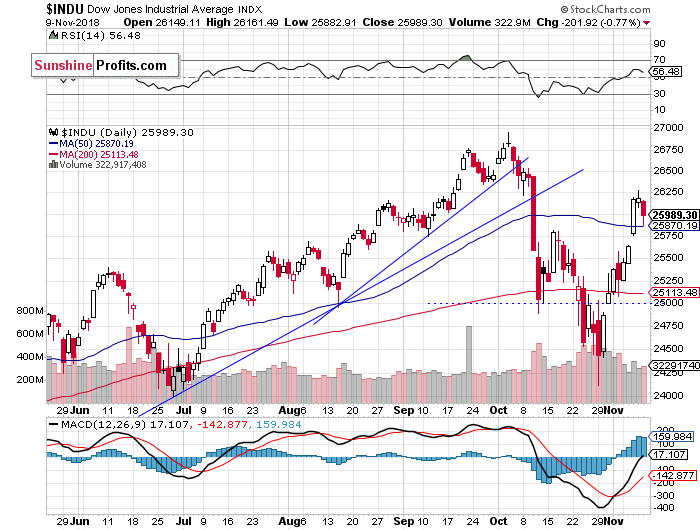
The Dow Jones Industrial Average retraced slightly more of its recent decline on Thursday. It accelerated above 26,000 mark and got closer to the early October topping consolidation recently. Then it retraced some of the rally on Friday. The nearest important level of resistance remains at around 26,500-27,000, marked by the record high:
Japanese Nikkei Closer to 22,000 Mark Again
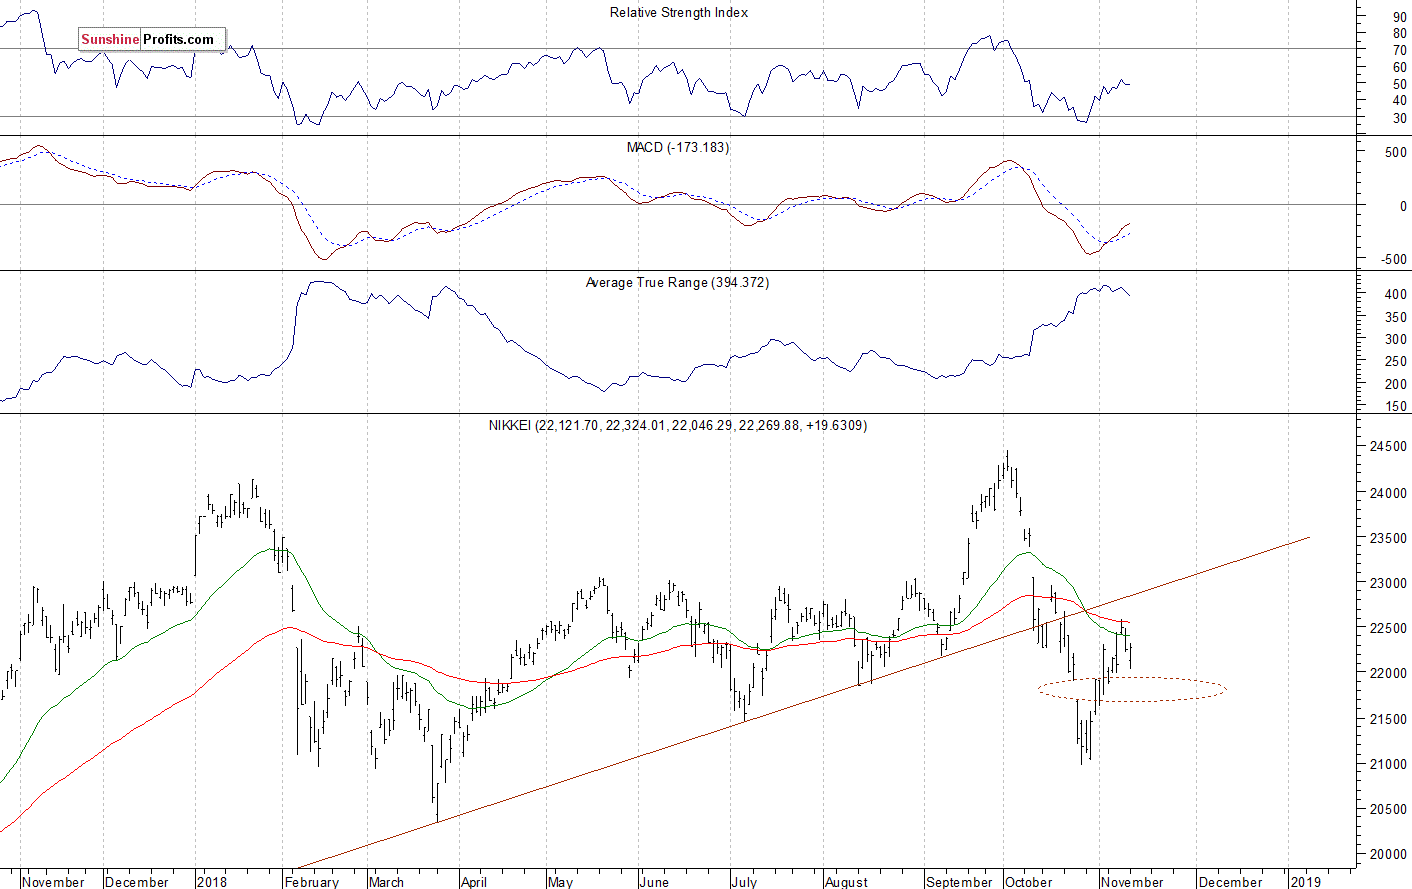
Let's take a look at the Japanese Nikkei 225 index now. It retraced more of its October sell-off last week, but then it failed to continue higher on Friday following bouncing off the resistance level of 22,500. Today we saw more downward action. The Nikkei continues to trade below its broken long-term upward trend line, as the daily chart shows:
The S&P 500 index accelerated its short-term uptrend last week after breaking above its recent trading range. Stocks reached their short-term panic bottom two weeks ago on Monday. But will the uptrend continue? The market broke above the important level of resistance of 2,750-2,760. Then it reached the resistance level of around 2,800-2,820 and on Friday it reversed lower. It will likely fluctuate along the resistance level of around 2,800 for some time.
Concluding, the S&P 500 index will probably open virtually flat today, as investors' sentiment worsened following Friday's decline. However, there have been no confirmed negative signals so far.
Disclosure: None.


