
S&P 500: A Critical Juncture Amid Historically Bad Milestones
It seems like the odds favor a strong bounce to close the year if only to bring the December drawdown a little closer to historic norms. At least the timing would be right given deep oversold trading conditions. Of course, a “reversion to the mean” is not reason enough to expect a strong year-end rally.
To-date, the S&P 500 (SPY) is down 8.8% for the month of December. This drawdown rivals even this past October where the maximum drawdown of 9.4% on a closing basis was the third worst since 1951. If December ended today, it would exactly match the worst December since 1951 which was a 9.4% loss in 1980. The second and third worse Decembers were in 2008 and 1974. Note that just 4 years ago, December delivered a maximum drawdown of 4.6%, the 9th worst since 1951. The subsequent year (2015) was a very volatile year where the S&P 500 churned for over 7 months before suffering a “flash crash” and large sell-off before a bottom in early 2016. (Clearly my next exercise should be to quantify any significant correlations between poor Decembers and the performance of the following year!)
(Click on image to enlarge)
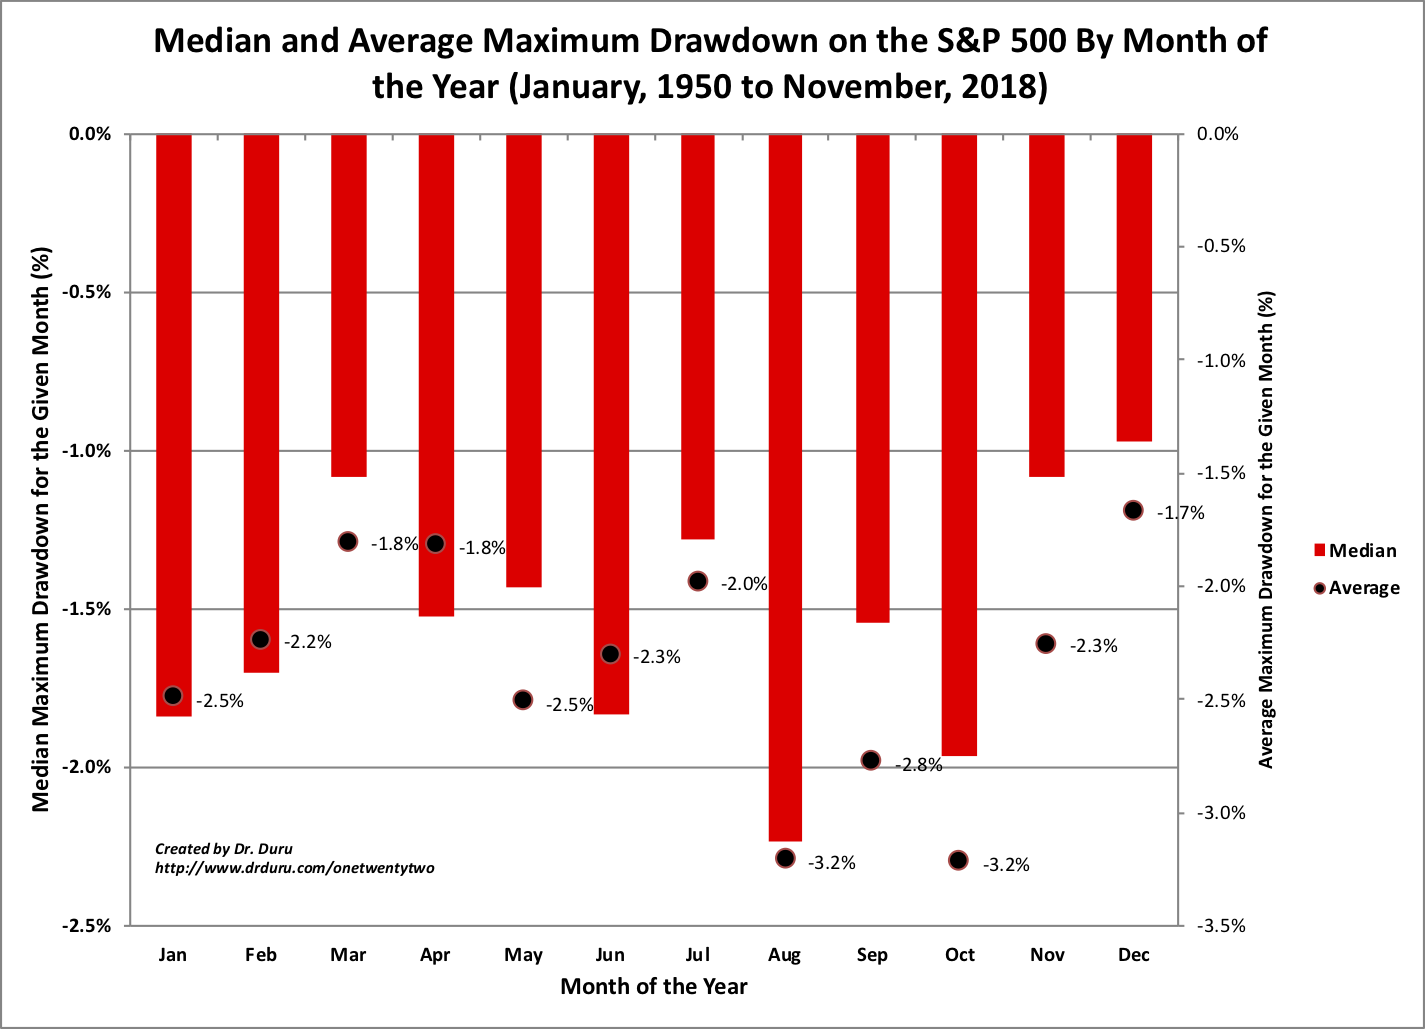
Median and Average Maximum Drawdown on the S&P 500 By Month of the Year (January, 1950 to November, 2018)
This historic drawdown is also throwing up loud alarm signals for the “200DMA Signal.” I created the 200DMA Signal as a relative measure of the severity of a sell-off after the S&P 500’s 200DMA prints its first 5-day loss following an all-time high. This kind of turn has only happened 19 times since 1951; it is a surprisingly extreme kind of event. The last occurrence was on October 24th of this year. At that time, the S&P 500 was off its all-time high by 9.4%. The index is now down 13.1% from its all-time high. If the S&P 500 rallied its way to a new all-time high from this low, the “warning ratio” – the ratio of the drawdown at the time of the turn in the 200DMA and the ultimate closing low before the next all-time high, would be 0.72 (= 9.4/13.1). This ratio matches the 0.77 warning ratio from the last 200DMA Signal in August, 2015.
(Click on image to enlarge)
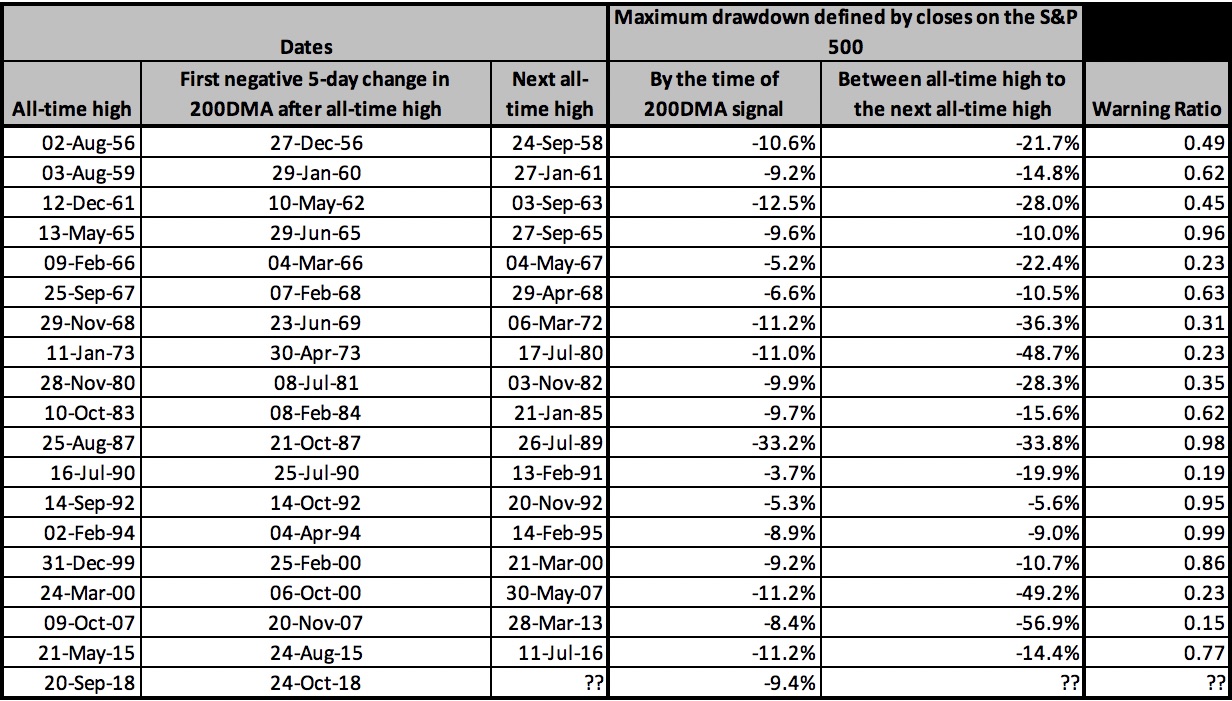
The latest 200DMA Signal triggered on 10/24/18.
The above table suggests that IF the S&P 500 does not hold a bottom here, then a much larger sell-off will be in play. Nine of the twelve 200DMA Signal episodes with worse (meaning lower) warning ratios delivered ultimate bottoms only after the S&P 500 dropped at least 20% from its all-time high. If this 200DMA Signal has meaning, then the odds are leaning heavily against the S&P 500 right now.
Starting last week, I discussed the possibility of a fresh wave of selling to start 2019. The 200DMA Signal indicates the risks are even higher than I thought just looking at the technical setups. The Federal Reserve’s task in the coming meeting on monetary policy is also even MORE difficult than I thought!
(Click on image to enlarge)
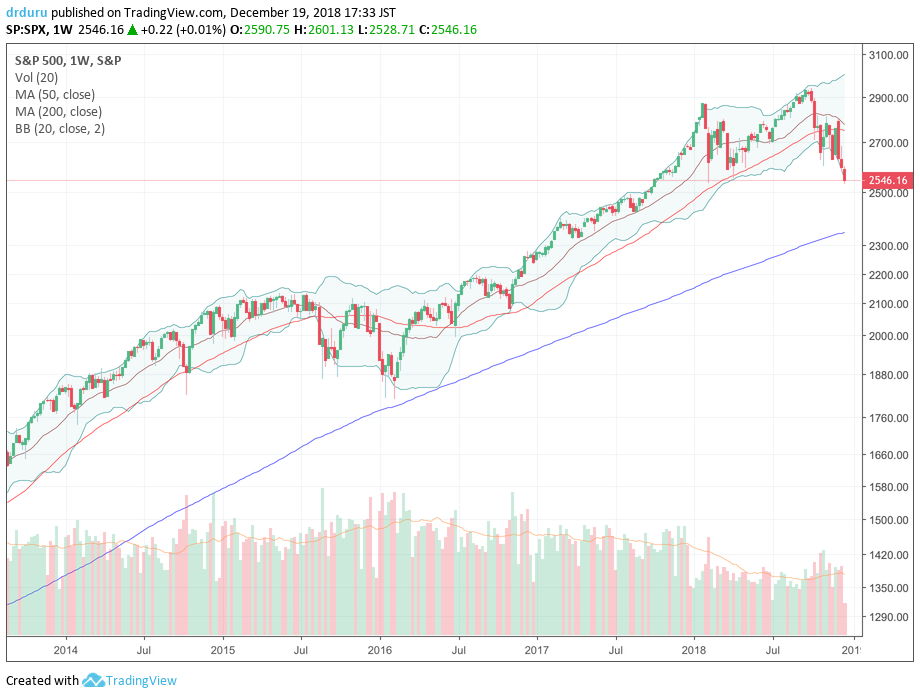
This weekly view of the S&P 500 (SPY) highlights the technical importance of this juncture for the S&P 500. The new 2018 closing low opens up the potential for a much larger sell-off, especially given the run-up to this topping pattern was so fast it created only weak “natural” support levels.


