
S&P 500; 6-months Divergence Continues Here

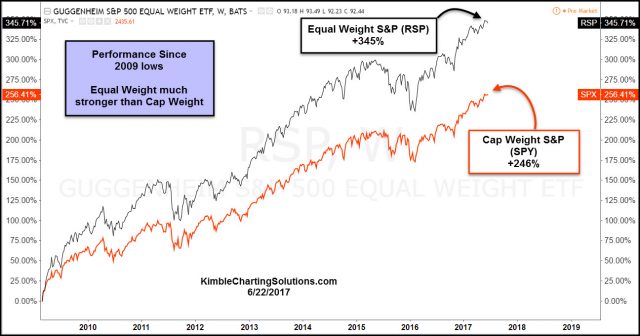
When it comes to S&P 500 ETF’s, they may be equal (which stocks they own), yet they can be very different when it comes to performance. Below is a comparison between the Equal Weight S&P 500 ETF (RSP) to the S&P 500 (SPY) (which is Cap Weighted), since the 2009 lows. Which ETF would you rather own, RSP or SPY?
CLICK ON CHART TO ENLARGE
RSP might own the same stocks at SPY, yet the performance is drastically different, due to how much of each stock each ETF owns. RSP has done much better since the lows in 2009, up almost 90% more than the S&P.
Below is a chart for the RSP/SPY ratio over the past 15-months:

CLICK ON CHART TO ENLARGE
The RSP/SPY ratio in the long term, remains in an uptrend, as RSP has been much stronger than SPY. Over the past 6-months, this is not true, as the ratio peaked late last year at (1) and continues to create a series of lower highs, inside new short-term falling channel (2). This week the ratio is hitting the lowest level in the past year.
Historically bulls want to see this ratio heading higher. The short-term weakness does not send a bearish message, it does send a message that the broad market is not as strong as a few big players in the index.
One ratio does not make a trend, please keep that in mind! Keep an eye on this ratio over the next couple of months, as it could send important message to bulls or bears going forward.
Sign up for Chris's Kimble Charting Solutions' email alerts -- click here
.


Thanks