
Soup And Oil
One of the neater things that comes from researching the historic prices of everyday goods is the insights that you can extract from the data, where sometimes, you discover that you can divide a nation's economic history into distinct eras.
Here's an example of what we mean. We started off with the idea that it might be interesting to look at the history of the price of Campbell's Condensed Tomato Soup and also the price of crude oil in the U.S., where we were able to get monthly data for both series back to January 1946, which means that we're capturing the entire post-World War 2 era in the United States.
The reason why we were doing that is because oil, along with tomatoes and steel, can be considered to be one of the three primary ingredients for making Campbell's Condensed Tomato Soup, thanks to its role in fueling the supply, production and distribution networks for making industrial quantities of the iconic product available for sale in the U.S. economy.
So we did, and for the sake of making a more direct comparison between the two sets of prices, we converted the sale price of a typical 10.75-ounce can of Campbell's Condensed Tomato Soup into the equivalent price of a 42-gallon barrel of the product! The following chart shows the results of that math, where we discover that there are three distinct periods in the post-war economy for the United States.

The three periods are:
- The post-World War period where the gold standard was in effect, until it was terminated on 15 August 1971.
- An economic transition period where price controls were arbitrarily used in an attempt to control inflation to various degrees for different products from 15 August 1971 through 30 April 1974 (for food and other products), and through 30 June 1979 (for oil), although some price controls on oil remained in effect until they were fully eliminated on 29 January 1981.
- The period since 29 January 1981 where neither a gold standard nor price controls have been in use in the U.S. economy.
Although we're looking at nominal prices per barrel for both products, there's enough change in their level over time to make it worthwhile to look at the same historic prices on a logarithmic scale to give a sense of the relative percentage changes that have taken place in the prices of each.
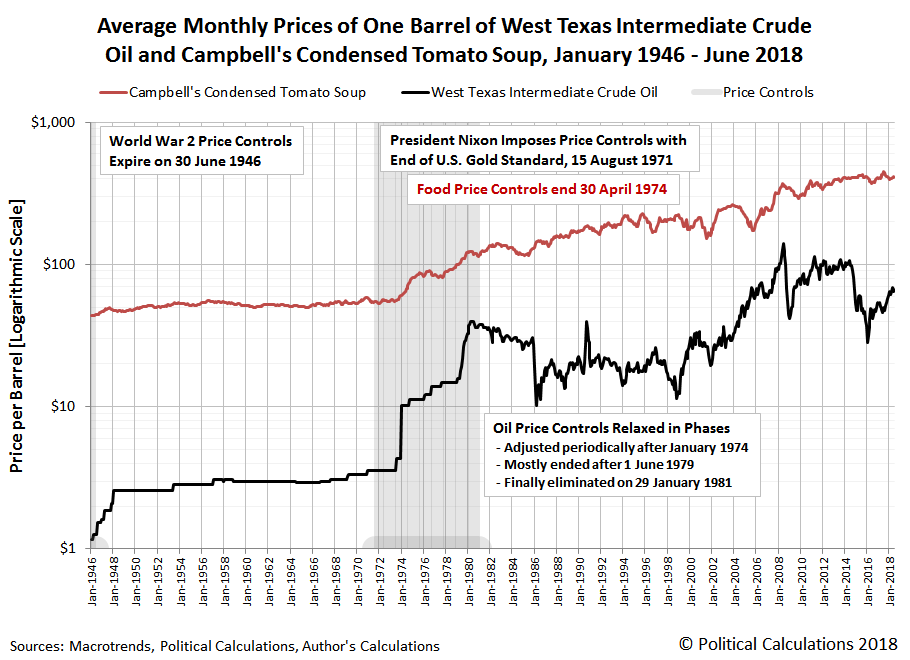
In this second chart, we see that the price of crude oil has been much more volatile in relative percentage terms than changes in the price of Campbell's Condensed Tomato Soup!
The different eras that we see in these charts are really only evident if you look at the nominal, or actual, prices that people paid for the products at the time they were sold. The following chart adjusts these prices for the effects of inflation, where the results are expressed in terms of constant May 2018 U.S. dollars, where you may be surprised by the historic cost trends for both soup and oil.

If you had the impression that soup is no longer the consumer bargain that it used to be as recently as just over a decade ago, you're right! That adverse price trend is one of the reasons why Campbell's Soups (NYSE: CPB) has been struggling in recent years.
Disclaimer: Materials that are published by Political Calculations can provide visitors with free information and insights regarding the incentives created by the laws and policies described. ...
more

