
“Small-Cap Value” Is Not Just Value With A Smaller Size Filter
Small-cap and large-cap stocks don’t just differ in terms of size. These classifications involve two very different kinds of companies that require very different approaches to analysis. It’s not a statistical thing: The difference involves fundamentals. So when searching for small-cap value, it’s important to avoid using the same approach one used for large-cap that only changes the size requirements. Here’s an approach to small-cap value “investing” that can work even today, even though the value “factor” is cold.

For Starters: “Value Investing” Versus The “Value Factor”
Value investing works. It always worked in the past. It works now. It will always work in the future. To suggest otherwise would be to deny human nature, the tendency to buy something at a lower price and to bypass an offer from one who sells the exact same product or service at a higher price. A rational buyer will pay a higher price for something only if there is a particular reason to do so (better service, more convenient method of shopping, better buying experience, better warranty, not knowing of a cheaper alternative, etc.).
In an ideal market, a higher price (P/E) will be associated with a better company. Financial theory tells us to evaluate P/E in terms of the expression 1/(R-G) where G is expected Growth and R is required rate of return, which depends on market interest rates, a premium for investing in risky equities as opposed to risk-free fixed income, and another premium to reflect company-specific risk/quality. For details on the logic behind this, see my large-cap value screen post or the strategy design cheat sheet posted on my blog site.
The fun occurs because we all have our own ways of assessing 1/(R-G) and come up with different (sometimes wildly different) answers. But however we go about it, this process, matching up the level of the price we pay with the merits of the company we get, is what “value investing” is all about. This process always works, but we don’t all implement it with equal effectiveness. Those who are great at it become known as legendary value investors. Those who screw it up a lot tend to complain that value investing is for losers.
The value factor, on the other hand, (the thing about which Fama, French and countless followers talk about) is an altogether different animal. It’s simply a best-to-worst sort of a preferred value ratio. Academicians tend to like BM, book to market, apparently forgetting what else BM stands for (until they need to go for a colonoscopy) leaving the rest of us to describe it as PB, Price to Book; many others prefer P/E, P/S, P/FCF, stuff with EV, etc. The value factor is said to work when low valuation (or high BM) stocks outperform low valuation and is said to be cold when high valuation outperforms low valuation.
Goldilocks
Since the value factor does not consider1/(R-G), there will, as many have seen, be times when the value factor works and times when the value factor fails. The fortunes of the value factor depend on the variability of trend (mean reversion). Investors often (very, very often — downright habitually) over-interpret the past and assume that what we saw will continue to be seen forever. When reality steps in and turns things around, those who are caught with high ratio stocks get slammed (because the trees they supposedly held did not grow to the sky after all) and those who owned low-ratio laggards get rewarded when those former duds improve. In that environment, the value factor works.
The value factor is not, however, working now because the trend (good economy, good earnings, non-terrifying interest rates) has been persisting for a heck of a long time. Those who hold high-ratio stocks expecting great things in the future have not lately been punished for being too optimistic and those who own bargain-ratio weaklings have not yet enjoyed the transition to success.
Therefore, to succeed in this Goldilocks — all is just right — environment, value investors need to go beyond the value factor. In order to work with the factor, it’s essential to limit its application to a world in which we “control for” 1/(R-G). This screen, like the large-cap version, searches for good valuations, not throughout the market, but only within a pre-qualified list of companies for which it’s reasonable to assume good things from 1/(R-G). The adventure comes because 1/(R-G) isn’t the sort of formula you can plug into a spreadsheet. These are future-oriented inputs that cannot be known. So instead of acting like physicists or rocket scientists, we act instead like police detectives searching for clues that allow us to infer the existence of something for which there are no witnesses. That’s how I approach screen building, and that’s how you can assess the rules I create; treat them as clues at the scene of, well, you know.
Small Versus Large
Everything I wrote up to this point suggests I should simply repeat the large-cap screen I described on July 27th but with a different market cap rule. In fact, all I need do, one would think, is revise my starting “universe” from the one I used based on the Russell 1000 to something based instead on the Russell 2000. That’s all well and good for use of the value factor. But it won’t do for value investing. Small companies are inherently different from large companies and in ways that suggest we think differently about how we seek and interpret clues regarding 1/(R-G).
A lot of differences can be summed up in a well-known phrase: economies of scale. This is a real concept and large companies tend to have it. On the other side of the coin, we have diseconomies from the absence of scale, and small companies are likely to have that.
Financially speaking, this manifests as operating leverage, the prevalence of fixed costs and the way the balance between fixed and variable costs causes profits to fluctuate mildly or wildly based on a given percentage change in sales. For those who slept through cost accounting, if you’re into small caps, I suggest you refresh yourself on Google. Until you get a chance to do that, suffice it to say that the larger the portion of a company’s costs that are fixed, the greater the degree of operating leverage meaning the greater will be the level of profit fluctuation for a given change in sales. Interest expense is one form of fixed costs. (When I say fixed or variable, I mean within context; companies can, of course, vary it by cutting debt) This is why debt-heavy companies are risky. Interest costs don’t go down just because sales dropped.
Fixed interest costs can plague large and small companies alike, depending on management capital structure choices. But fixed operating costs are more inevitable. Certain businesses require certain kinds of fixed costs that don’t get eliminated just because a company is small (for those who actually paid attention in cost accounting; I know all about step costs but I just want to keep this simple). This is why startups often lose money. Early stage revenues are likely to be too small to cover fixed costs, even if variable costs are fully covered. The goal of a small company is to grow into and then past, and hopefully, way, way, past its fixed cost burden.
This is important stuff. Unfortunately, however, foundational FASB members and/or staffers may have slept through cost accounting. They did not require companies to report this way. So we investors can’t be sure of how these are allocated. The best we can do is approximate and a good (or at least tolerable or not overly dreadful) way to do it is to pretend cost of goods sold are variable and selling, general and administrative expenses are fixed. So the difference between gross margin and operating margin tells us something about operating leverage (until my next life, when I come back as head of FASB and require these breakdowns — nah, skip it; I plan to come back and be among the idle rich).
There’s another important issue: diversification. Just as you want to hold a diversified portfolio to reduce the risk below what you’d face if you put 100% of your assets into one security, or 50% of your assets in each of two securities, so, too companies diversify against sales risk by diversifying their business portfolios. This can involve different businesses (the conglomerate model which has long since ceased to be hip) but also and to a larger degree than many realize, diversification within a single industry (different types of products and/or services to different kinds of customers, different levels of the supply chain, different regions, etc.). Smaller companies tend to be less diversified than their larger cousins.
A complete discussion of this topic is a matter for another day, but for now, Table 1 offers a preview of the numbers by comparing key fundamental medians for the Portfolio123 approximations of the Russell 1000 and Russell 2000 universes. (As medians, these figures are not influenced by extreme data-points).
(Click on image to enlarge)
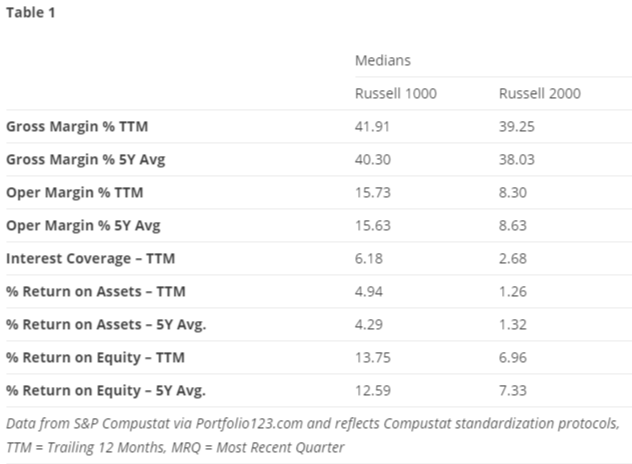
From operating margins down, we see the impact of fixed costs on fundamental metrics, and not just any fundamental metrics — fundamental metrics that tend to be especially important in screening and analysis of stocks.
Screening for Goldilocks Value — The Small-cap Version
As I did with large-caps, I’ll start with the obvious, a sort of stocks based on the Portfolio123 Basic: Value ranking system, my plain-vanilla model that looks a lot like many other ranking systems out there. (Value investing is not about super-top-secret formulas nobody else thought of; we all know and can easily calculate the same ratios. It’s about how the ratios are used. (If you want to see details of this particular ranking system, click here.)
Also as with large-caps, I’ll select the top 15 stocks (the 15 that have the lowest ratios) and refresh the list every three months.
And once again, I won’t stop here lest I run a high risk of ending up with a collection of stocks that’s likely to be no better than the ones causing everybody else to complain that value is “out.” I’m going to do as I did before, pre-qualify my list to eliminate, as best I can (the future is always unknowable so we do our best approximating using the information we have today), stocks that don’t deserve to be valued cheaply as they are because the companies have better growth prospects and/or are of better quality (i.e. lower risk) that would justify such low ratios. In other words, I before I rank for value (low P/E etc.) I screen for stocks that don’t deserve to be cheap due to clues suggesting favorable 1/(R-G).
The difference lies in how I tackle the task of assessing clues.
Here’s how I do it.
- I start with a Portfolio123 universe that approximates the Russell 2000 constituent list, a small-cap group. As we saw above, this list does not provide nearly the same level of overall company quality as we had when we worked with a list based on the Russell 1000. We’ll keep that in mind as we go further.
- It’s hard to screen for future growth. All we can do in our non-psychic world is work with indirect information that can be used as proxies for investor judgments, in this case, favorable judgments regarding future growth prospects. For this screen, I require ranks above 50 (on a 0 to 100 scale) on the Portfolio123 Basic: Sentiment ranking system. That’s a higher standard than the 25 thresholds I set for the large-cap screen. There, I was dealing with a generally good-quality universe and was mainly interested in eliminating the worst of the worst in terms of sentiment. Here, with a lesser quality universe, I ask more of the judgment-based test and raise the threshold to 50.
- Next, I need to eliminate the probable dumpster fires. Among the large-caps, I did this with a market-based test; I omitted the lowest of the lowest valuations, assuming the market was wise enough to award such multiples to only the true dregs. Here, with many lesser quality firms in our universe, I use a more company-based test: I eliminate stocks ranked below 25 (out of 100) on the Portfolio123 Basic: Quality ranking system.
Testing the Screen
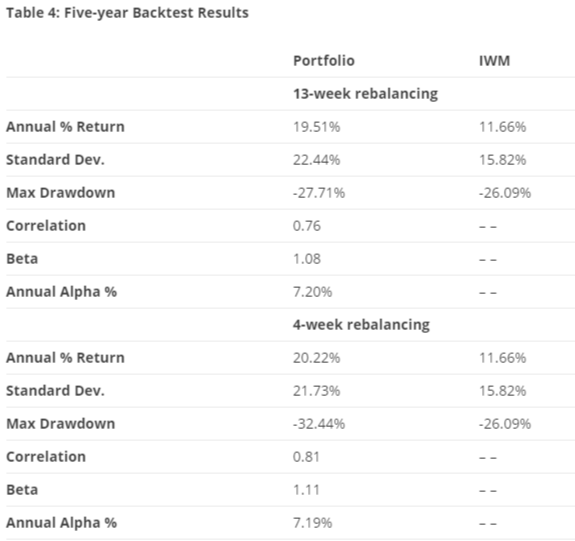
Table 4 shows the results of a basic start-to-end backtest of the screen (it assumes a 0.25% slippage penalty on all positions that enter or exit the hypothetical portfolio). Table 5 shows the results of a rolling backtest test, in which a set of self-contained three-month or four-week portfolios each starting a week apart are tracked). The benchmark is the iShares Russell 2000 ETF (IWM).
(Click on image to enlarge)
(Click on image to enlarge)
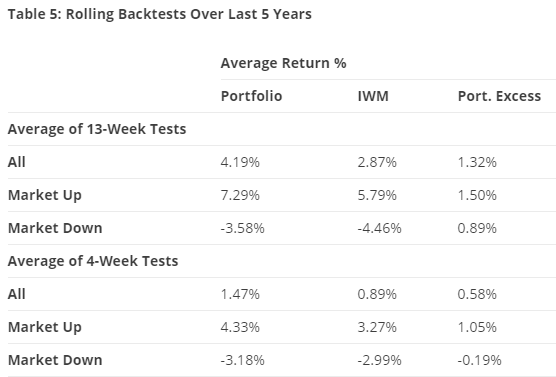
The results are in line with expectations. If one is bullish on the market, as would be the case if one assumes the current Goldilocks scenario will persist, the 13- and 4-week refresh intervals are comparable. In down markets, however, the patience of the 13-week time horizon seems better.
The Companies
Here are the companies that currently appear in the screen:
American Axle & Manufacturing (AXL)
Bed Bath & Beyond (BBBY)
Barnes & Noble Education (BNED)
Beazer Homes USA (BZH)
Clearwater Paper (CLW)
Genworth Financial (GNW)
Hallador Energy (HNRG)
KB Home (KBH)
Lannett Co (LCI)
McDermott International (MDR)
Nexeo Solutions (NXEO)
Office Depot (ODP)
Tutor Perini (TPC)
Tribune Media (TRCO)
United Natural Foods (UNFI)
Conclusion
As with the large-cap version of this approach, I would not use this as a pure model-based portfolio through which I’d own all stocks that appear. I’d use it instead as an idea generator that prompts further company-specific examination. On the whole, though, I believe it serves as a useful way to find bona fide value investments in the context of today’s growth-momentum driven market.
Disclosure: None.


