
Small Cap Redux
Top scoring weekly returns: Buy and Hold 1 Year
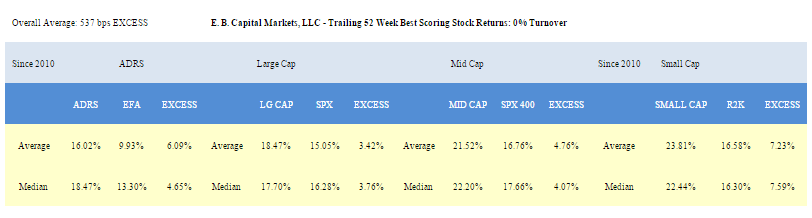
NOTE:The ideal time horizon is 6 to 12 months from the time an idea appears in our ranking
020202.png)
Last weekend we made the case for small cap stocks and this week we offer additional insight further down in this report.
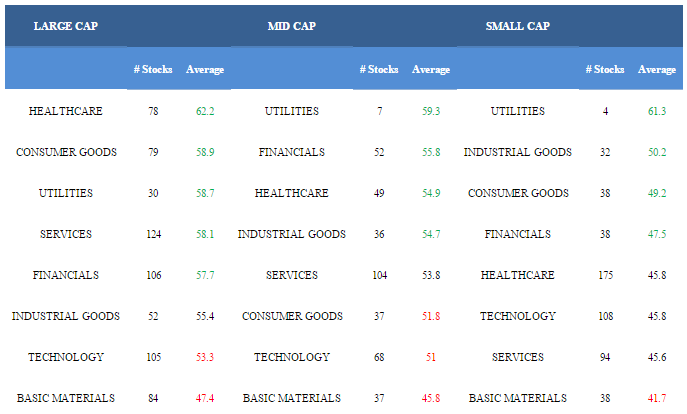
Thanks to the money flow inputs to our score, utilities and healthcare are the two best scoring sectors this week.
Financials, industrial goods, consumer goods, and services score in line with the average universe -- be industry and stock specific in those baskets. Technology and basic materials score below average -- be stock specific in those groups.
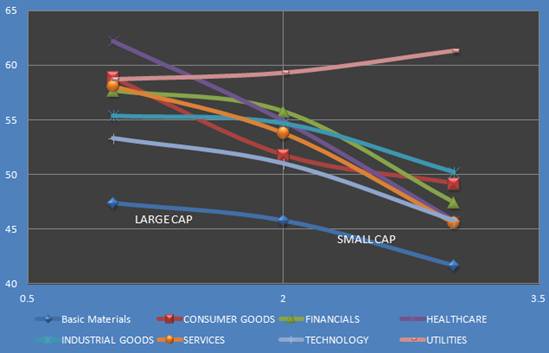
The following chart visualizes score by sector and market cap.
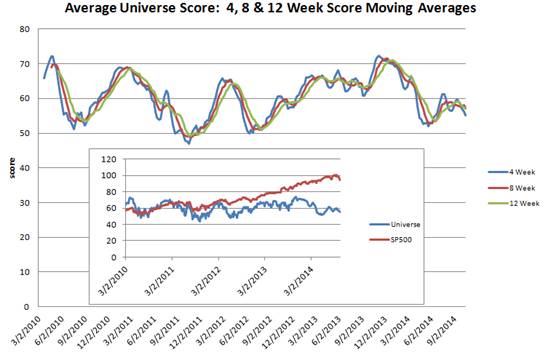
This next chart shows historical four, eight, and 12 week moving average scores across our universe.
In last weekend's report I suggested that small cap offered upside opportunity based on historical seasonality and overly pessimistic short interest. In case you missed my previous reports on Sunday and Thursday, here is that data again.
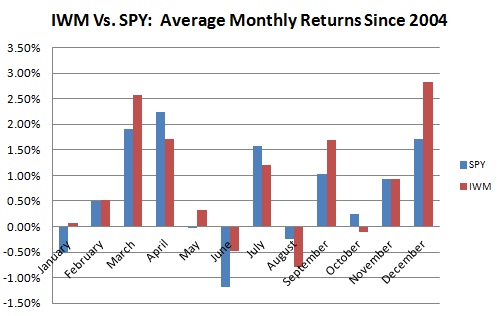
Research back to 1979 conducted by the Stock Trader's Almanac shows a distinct advantage for small cap in winter. That research is backed up by the following chart I compiled showing average monthly return for the IWM and SPY since 2004. Notice that the R2K's worst months are typically in the summer and its best months are in the winter and heading into spring.
The following table shows the IWM's Q4 return history over the past decade. The IWM has gained in 8 of the past 10 Q4's, producing a median 6.34% return in the quarter. The two losing years were (as expected) 2007 and 2008.
45545.png)
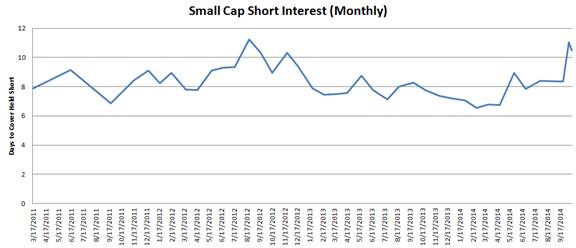
The next chart breaks out weekly average short interest for our small cap universe, which is made up of more than 600 widely traded small cap stocks. The chart shows that small cap pessimism typically heads higher into fall and that short covering historically provides upside support for small cap stocks into year end. The data also shows that the average short interest in small cap is near its highest post-recession levels since 2012. I have updated the chart from last weekend, and you'll note that there was a slight tick lower in short interest in the most recent period. This may indicate that speculators are already beginning to rein in short side bets.
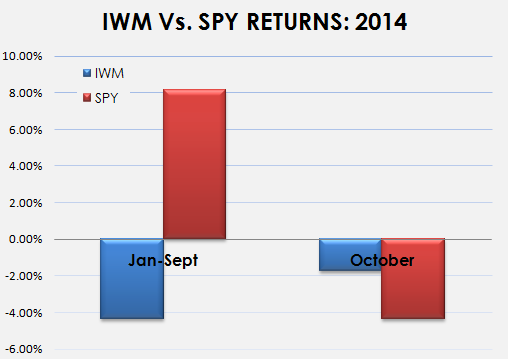
The next chart also suggests that small cap pessimism may be fading.
In September, Russell reported that the spread between large and small cap year to date returns was the widest since 1998. The IWM significantly underperformed the SPY through the first nine months of 2014; however, the R2K is outperforming the SPX so far this month. For interest's sake, the R2K returned -2.55% in 1998 and 21.26% in 1999. Since my report last weekend, the IWM gained 2.6% this past week, versus the SPY dropping -1.08%. Small cap's performance spread may continue to narrow into year end.
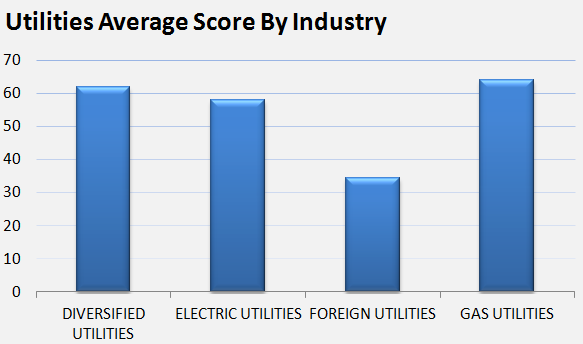
UTILITIES
The following chart shows average score by utility industry. Gas utilities score best ahead of winter.
.png)
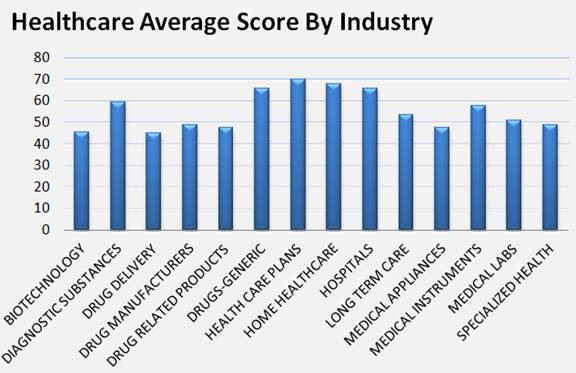
HEALTHCARE
The next chart shows average score by healthcare industry. Insurers score best heading into the ACA's second open enrollment period. Home healthcare, generic drugmakers, and hospitals also score strong.
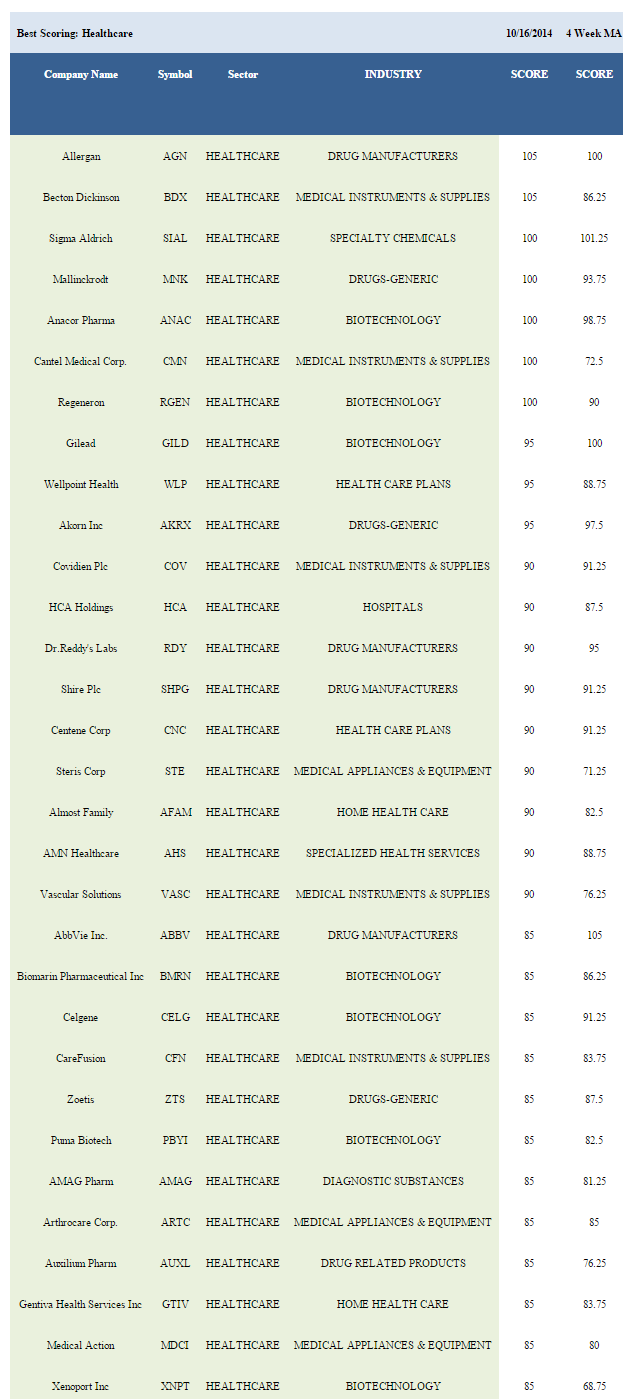
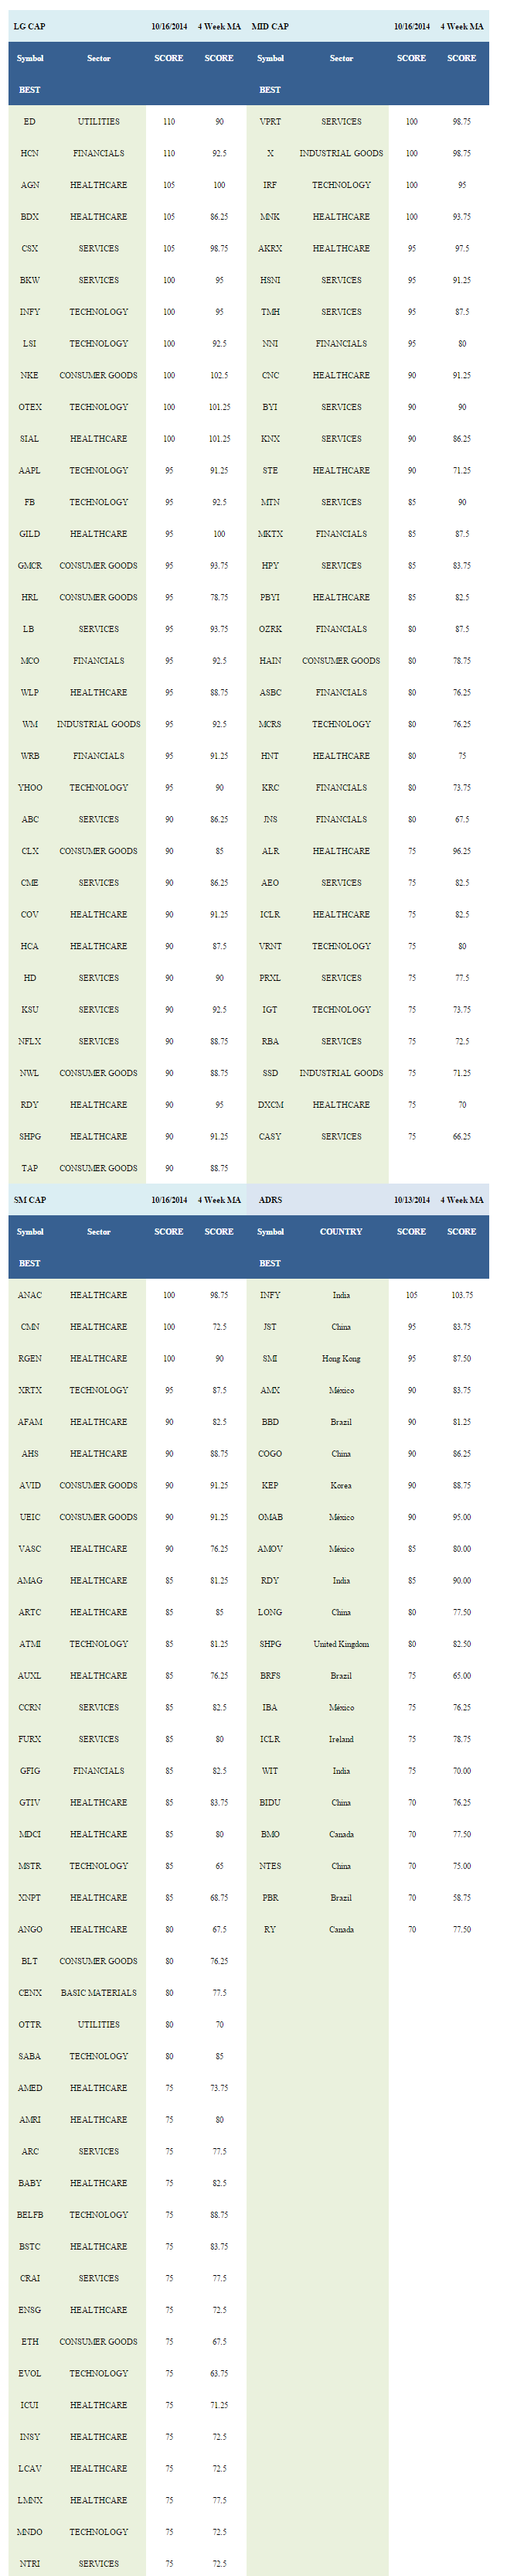
TOP SCORING
Disclosure: None.


