
Silver Prices Consolidate With A Symmetrical Triangle
The price of Silver (Ticker: XAG/USD) has turned lower this morning, after being rejected at intraday resistance near today’s high of $18.85. A turn at this point is critical because it suggests that Silver prices are now trading in a short term symmetrical triangle. This technical price pattern can be seen depicted below, and has been formed by first connecting a series of lower highs in the price of Silver. Support for the pattern has alternatively been drawn by connecting a series of swing lows starting with the August 28th low at $18.36.
One possibility, suggests that that prices may continue to consolidate in this triangle pattern for the remainder of today’s trading. In this scenario, traders may continue to look to buy Silver near the line of support, or sell as Silver prices bounce off of resistance. It should be noted that an eventual breakout will conclude this pattern, at which point traders may elect to then trade in the markets chosen direction
Silver Prices 30 Minute Chart & Triangle
(Click on image to enlarge)
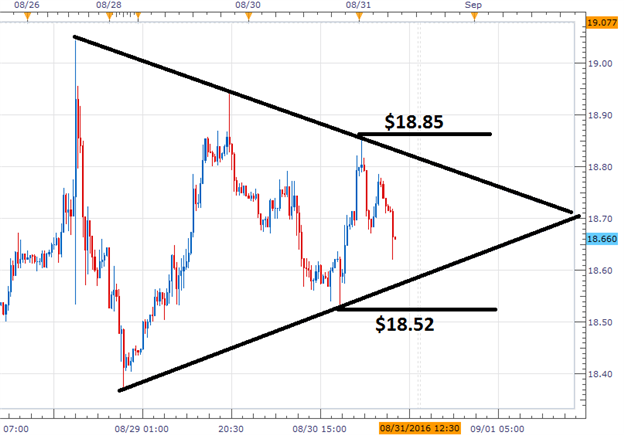
Traders opting to trade a breakout, should continue to monitor the previous swing high and low in Silver. If a bullish breakout transpires, Silver prices should not only breach triangle resistance but continue to challenge the previous high at $18.85. Alternatively if prices break through triangle support, breakout traders may look for prices to first challenge the previous swing low in Silver at $18.52. In this scenario, traders may elect to avoid the current consolidating market but plan entries once a market direction is deciphered.
Disclosure: None.


