
Silver Enters Bear Market As Hedgies Flee
After tagging $19 the night of Trump's victory, Silver prices have tumbled 15% (the biggest drop since Summer 2013's taper tantrum). However, as large speculators dumped their longs en masse, this week also marked another milestone as Silver drops 24% from its post-Brexit peak (above $21) and entered a bear market once again.
As the dollar surges, Bloomberg reports that gold and silver holdings in exchange-traded funds are set for the biggest monthly drop in more than three years.
And, just as we have seen in gold futures, hedge fund speculative longs in silver are also decling rapidly...

And this selling pressure has slammed Silver to six-month lows (down 24% from Brexit highs in June)...

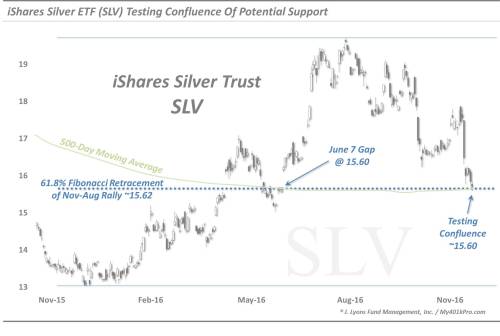
But, as Dana Lyons' Tumblr explains, Silver prices are testing a confluence of potential support levels.
We often get questions about our technical analysis on specific assets or securities, especially as it pertains to potential support or resistance levels on the chart. We don’t post many of those types of charts anymore but we present one today in the chart of the popular iShares Silver Trust, ticker, SLV. The impetus was partially because of the amount of attention on PM’s, but primarily due to a potential inflection point on the chart.
Everyone asks “when is XYZ going to bottom”? There is no way to ever know for sure. The best thing you can do is identify the most likely points of support in order to put the best odds of success on your side. And the best setups are always when multiple key potential support levels line up in the same vicinity. Such a setup may be present now in the chart of SLV, in our view.
So what are the potential support levels?:
- The 61.8% Fibonacci Retracement of the November-August Rally ~15.62
- The 500-Day Simple Moving Average ~15.64
- The June 7 closing price (15.60) from which SLV gapped up, launching it on its final run to 19.71
As the chart shows, SLV is testing this level today. In fact, the low of the day was exactly 15.60.
So will this 15.60 level hold? Obviously nobody knows for sure. At least there are multiple key levels of potential support there, however. That puts decent odds of success with the silver bulls – as well as giving them a level with which to play off of. If SLV remains above there, it can bounce. If it closes below there without an immediate reversal, perhaps there is more downside to come for silver prices.
How far will SLV bounce if it holds? Obviously, we can’t know that either. There appears to be considerable potential resistance near 16.80 and just above 18.00, if the SLV does bounce. So, that would be about 7-15% of upside – without even breaking the post-summer intermediate-term downtrend. It would take a lot more strength to convince us that the post-2015 uptrend is resuming. So, even holding this level doesn’t mean it’s up, up and away again for silver.
For now, precious metals fans will have to be satisfied with, “Hi Ho Silver, A-Bounce!”
Disclosure: None


