
Sideways Silver Market
Not much price action at the metals tables in the casino. Gold -$7, and silver -$0.10. Gold to silver ratio unchanged.
This will be a brief report, due to the rigors of travel this week.
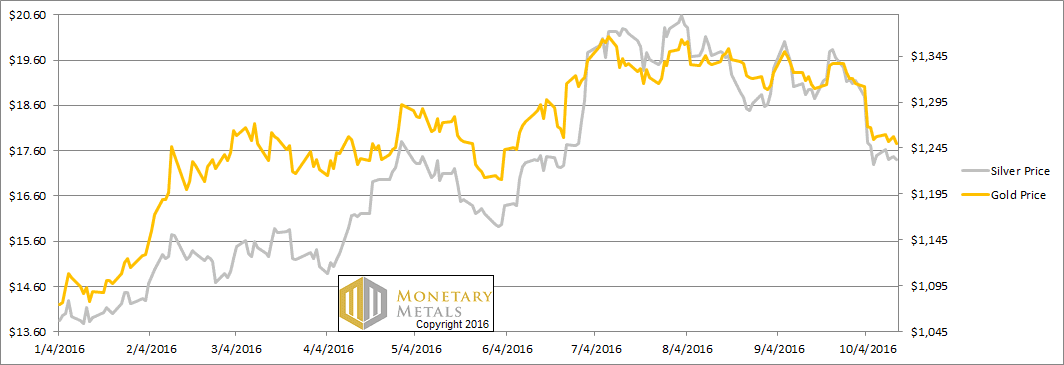
Read on for the only true picture of the fundamentals of the monetary metals. But first, here’s the graph of the metals’ prices.
The Prices of Gold and Silver
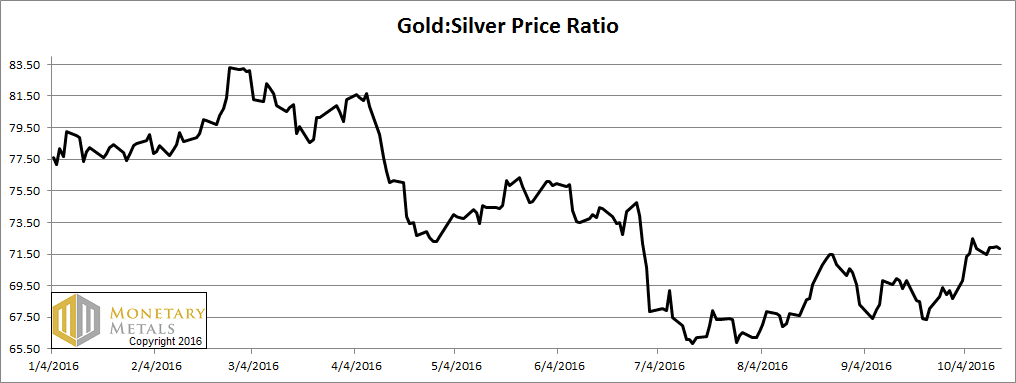
Next, this is a graph of the gold price measured in silver, otherwise known as the gold to silver ratio.
The Ratio of the Gold Price to the Silver Price
For each metal, we will look at a graph of the basis and cobasis overlaid with the price of the dollar in terms of the respective metal. It will make it easier to provide brief commentary. The dollar will be represented in green, the basis in blue and cobasis in red.
Here is the gold graph.
The Gold Basis and Cobasis and the Dollar Price
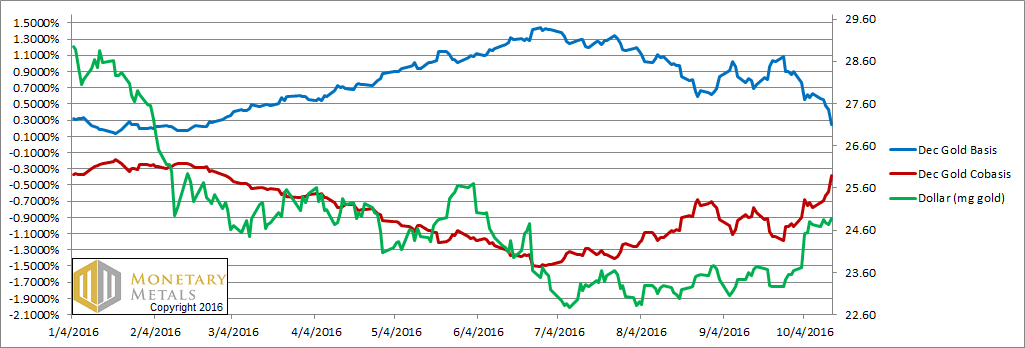
Gold’s scarcity (i.e. red line, cobasis) is up this week, though the price of the dollar (i.e. green line, the inverse of the price of gold) didn’t move much.
Now let’s look at silver.
The Silver Basis and Cobasis and the Dollar Price
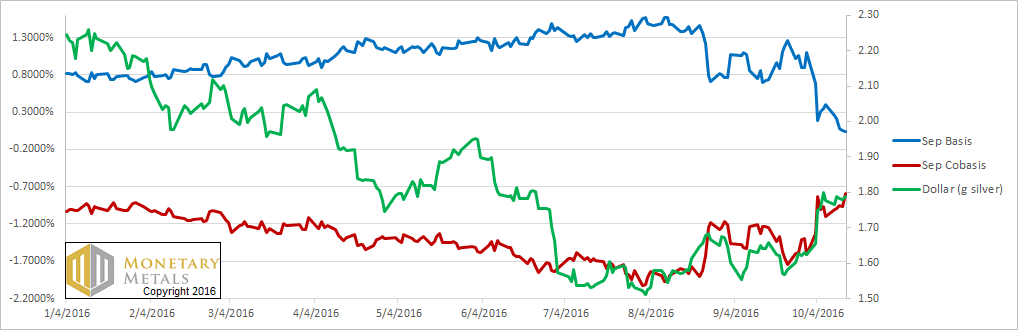
The cobasis rose, but not so pronounced as in gold.
There is so much more to say. Read the full Monetary Metals Outlook 2016 (free registration required). We explore in-depth the points made ...
more

