
Short-Term Correction Underway
SPX Long-term trend: If the market strength persists, the long-term trend may need to be re-evaluated.
SPX Intermediate trend: SPX intermediate count to 2240 may turn out to only be a minimum projection.This will be determined by market action over the next couple of weeks.
Analysis of the short-term trend is done on a daily-basis with the help of hourly charts. It is an important adjunct to the analysis of daily and weekly charts which discuss longer market trends.
Market Overview
There are two sharply contrasting views about the current stock market long-term condition:we are still in a bull market which still has months, and perhaps years, to go before it ends.This view is based on a modified version of the Elliot Wave analysis.The opposite opinion is that we have arrived at the top of the advance which started in March 2009, and it’s a matter of weeks, if not days, before we reverse and start a new bear market.This opinion is based on a comprehensive analysis of cycles.The analysts holding these views have a good track record, so it will be up to the market itself to render final judgment.
In support of a somewhat bullish view, my P&F analysis of the SPX gives me a minimum count to about 2230/2250; therefore, I see the probability of extending the current uptrend to at least this level before the bull market comes to an end.My analysis considers the present weakness to be of short-term duration, followed by the probability of a new high before a more extended decline begins.
We cannot ignore the fact that geopolitical forces are beginning to indicate that a world-wide re-shuffling may have begun, especially if today’s Italian referendum is rejected.If so, this is not likely to be bullish for the market, despite present appearances to the contrary.
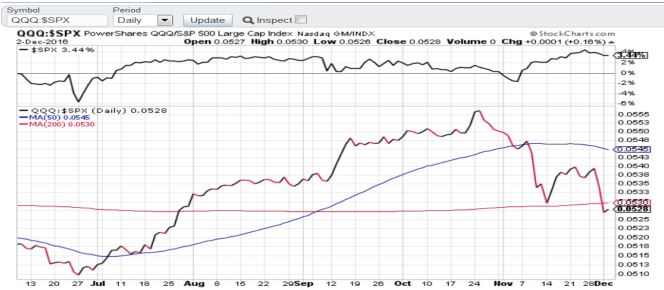
QQQ (NDX) has always been one of my favorite market leaders.Its relative strength to SPX is best expressed by the following chart: QQQ:SPX (Courtesy ofStockCharts.com).I have included the SPX (above) to illustrate the divergence which has taken place since the end of October even more clear.
The P&F chart of QQQ (115) shows that since August, it has built a congestion level which, if it is distribution, has the potential to take it back down to 95 -- its February price.At that time, SPX was priced at 1810.For this bearish count to be activated, QQQ would have to drop below 113, and keep going!I will continue to show this chart in future newsletters.
Analysis (This chart and others below, are courtesy of QCharts.com.)
Daily Chart
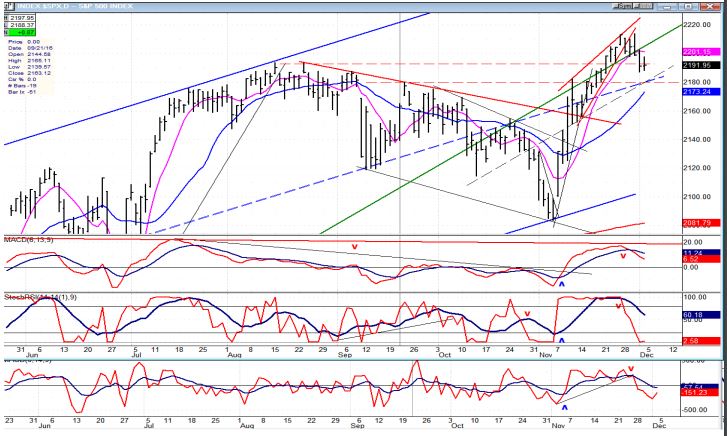
In the process of pushing to a new all-time high and overcoming the resistance of the intermediate trend line from 1810, SPX seemingly formed a wedge pattern (which is a bearish formation) telling us that the uptrend could not be sustained.Especially since during most of the advance from the 2150 retracement, breadth noticeably underperformed. After a final thrust to 2114 on Wednesday, a short-term correction is now underway.
As discussed in the previous letter, the pull to the downside is caused by a 6-week cycle which should make its low over the next two or three days, although a couple of minor cycles bottoming immediately afterwards could prolong the index’s bottoming action into the end of the week.As you can see on the chart, there is some good support around 2180 and, since there is a P&F projection just a little below that, it looks like a safe place for the minor correction to end.The unknown factor which could alter this scenario is the Italian referendum taking place on Sunday which could result in the resignation of the prime minister and the possibility of another withdrawal from the EU.
All three oscillators are in the middle of a decline, signaling that the correction is not over.As you can see on the chart, their previous histories suggest that they must turn up and make a bullish cross in their MAs before we can be fairly certain that a new uptrend is underway.As I explained in the preview, the coming rally should give us some clues about prospects for the market.If we start to stall around the minimum P&F price targets (or before) and cannot recover, it will be our first clue that the most bearish of the two opinions will turn out to be the correct one.
Hourly chart
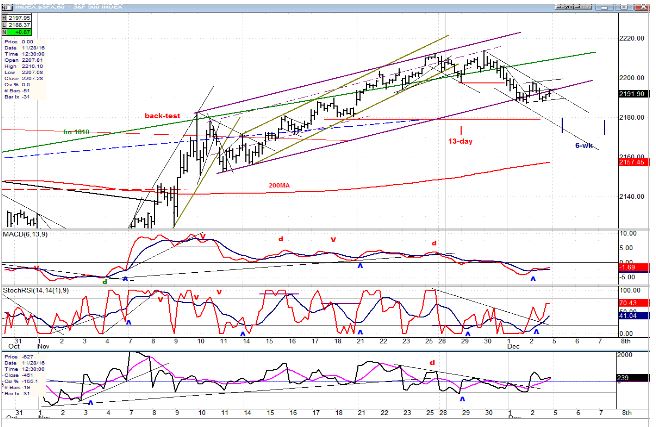
The hourly chart gives us another perspective of the price action from 1250. We can see that the rising wedge pattern was actually a narrow green channel in which price traveled until it met our projection (about 2112). After making a small double top, the index fell back below the green trend line from 1810 (which should, once again, become resistance) and traveled the width of the purple channel. It has found temporary support on the bottom trend line but is not likely to stay here long. It’s more than likely that the 6-wk cycle has not yet made its low and with the 13-day, and another minor cycle bottoming toward the end of next week, it should take at least that long for prices to reverse back to an uptrend.
The SRSI has turned up with the pause in the decline, but the other two oscillators have only flattened and do not show the strength associated with a reversal.
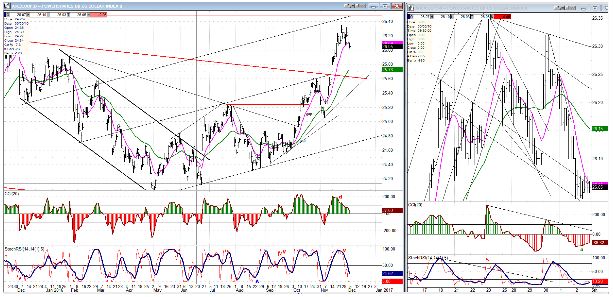
An overview of some major indexes (Weekly charts)
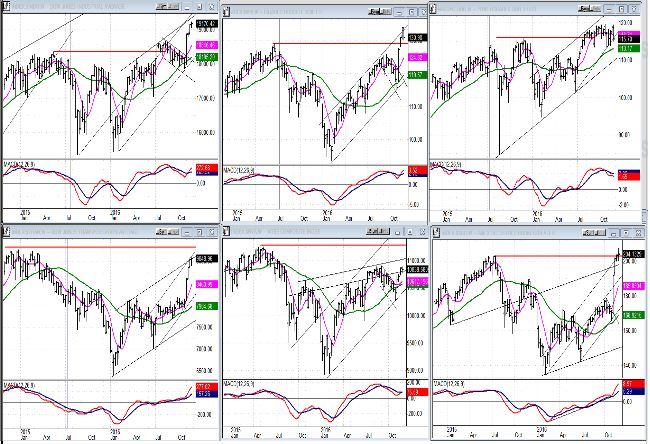
A minor correction does not have much of an impact on a weekly chart, especially on such a small scale, but it still makes it apparent that the strong remained strong, and the weak remained weak. Top right, QQQ still has not made a new high, and neither has NYA, bottom center. It will take some time to discern a new change in trend in the long-term market. Especially if there is more to go on the upside after this correction.
UUP (dollar ETF)
UUP is taking a breather after a strong thrust toward its former high. The jobs report did nothing for it! Perhaps if the Fed raises rates on the 14th it can renew it assault on the March 2015 high.
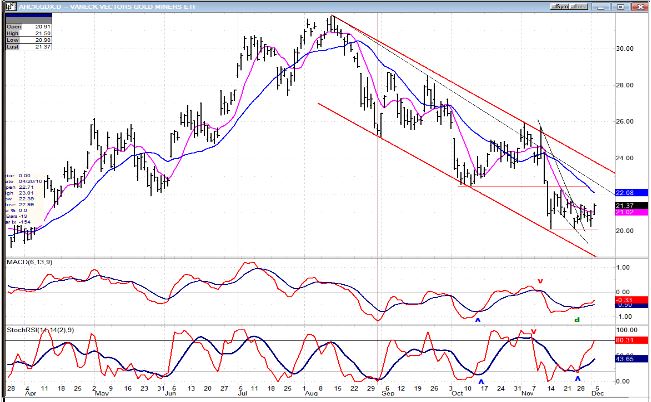
GDX (Gold Miners ETF)
GDX has started to build a base at the 20 level. Although there are potential lower counts, it may be time to take this seriously as a possible turning point since the correction has now retraced .618 from the August high. The daily indicators are still in an uptrend and the hourly have not turned down, so there could be another thrust to the upside that could challenge the overhead supply above 22.50 – especially if the Italian Referendum is rejected today! On the other hand, the breakout from the corrective channel may wait until after the middle of the month. If we do get a break-out from here, the initial wave could lead to 25.50-26.00.
Note: GDX is now updated for subscribers several times throughout the day (along with SPX) on Marketurningpoints.com.
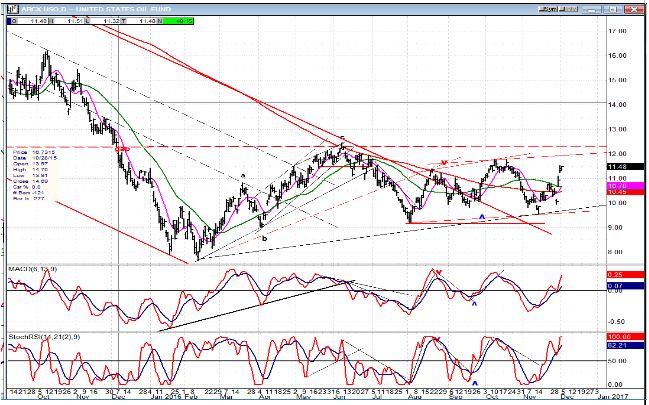
USO (U.S. Oil Fund)
USO has rallied to the level which has stopped the past two bounces. There is no sign that its uptrend is over, so the next few days will decide if it needs to build a larger base, or if it is ready to move out of the present one. If the latter, the move could extend to about 16.00.
Summary:
The beginning of a dichotomy is appearing in the stock market. The tech sector has been left behind in this rally and if this accelerates, it could start to rein in the DOW and other averages, that have soared to new highs. The chart at the top which depicts the relative strength of the QQQ to the SPX may be the best way to keep track of whether this divergence is only a temporary phenomenon, or something more lasting. I will continue to post this chart on a weekly basis.
Over the short-term, the SPX has started a correction which does not appear complete.
Disclosure: Market Turning Points is an uncommonly dependable, reasonably priced service providing intra-day market updates, a daily Market Summary, and ...
more

