
Sector Rotation Model Stays Bullish, Although Fundamental Rankings Are Still Stuck In Neutral
In a year in which stock prices mostly have been driven by news rather than fundamentals, three things stood out last week. First, terrorism has taken on an unsettling new face -- the stay-at-home mom down the street or your long-time co-worker at the plant -- as the dark side of the exponential growth in social media rears its ugly head (with something much more sinister than porn sites or online bullying). Second, with the strong jobs report on Friday, the Federal Reserve seems to have all their ducks in a row to justify the first fed funds rate hike in nine years. And third, oil prices may remain far lower for far longer, with potentially more negative than positive impacts. Nevertheless, bulls continue to be comforted by seasonality and a strong technical picture (which is shaping up much like 2011). Thus, although our fundamentals-based sector rankings remain mostly neutral, the sector rotation model still reflects a bullish bias.
In this weekly update, I give my view of the current market environment, offer a technical analysis of the S&P 500 chart, review our weekly fundamentals-based SectorCast rankings of the ten U.S. business sectors, and then offer up some actionable trading ideas, including a sector rotation strategy using ETFs and an enhanced version using top-ranked stocks from the top-ranked sectors.
Market overview:
Friday’s jobs reported was a big market mover. It showed that the U.S. economy created 211,000 jobs in November, beating expectations. September and October data was revised to show 35,000 more jobs than previously reported. And the official unemployment rate remained at 5% (i.e., what is generally considered to be full employment).
In response, U.S. stocks jumped more than 2% on Friday, with the Dow Jones blue chips and S&P 500 large caps posting their biggest one-day gains in three months. Nine of the ten S&P 500 business sectors climbed -- all except Energy, which fell after OPEC failed to put a lid on its near-record output.
Oil is the proverbial Goldilocks market that needs to be not too hot and not too cold to work for all market segments. Too low creates instability in oil-exporting countries and threatens the health and livelihood of our domestic industry, with its high-paying jobs, and that’s where we are today, and apparently heading lower.
The dollar, gold, and base metals all showed nice gains, as well, on Friday. The 10-year Treasury yield closed Friday at 2.28% after dipping as low as 2.15% on Tuesday and as high as 2.35% on Thursday.
On September 21, I wrote, "The Fed’s decision to not raise the fed funds rate at this time was ultimately taken by the market as a no-confidence vote on our economic health, which just added to the fear and uncertainty that was already present. Rather than cheering the decision, market participants took the initial euphoric rally as a selling opportunity, and the proverbial wall of worry grew a bit higher." But after Friday’s strong job’s report, which followed fairly definitive statements on Wednesday from Fed chair Janet Yellen about the economy being strong enough for an initial rate hike, market participants seemed just fine with the idea of the Fed giving a pro-confidence vote on our economic health in the form of a quarter-point fed funds hike.
Nevertheless, I will say again that I’ll believe it when I see it, given that the rest of the world continues with quant easing. But I must admit that the gap is narrowing, as we learned on Thursday that the ECB is injecting less than expected, which initiated Thursday’s selloff in stocks (Stoxx Europe 600 fell over 3%) and in the euro, causing that currency’s biggest single-day move in more than six years. As a result, yields on German 10-year bonds climbed 6 bps to above 0.70%, and the gap between 10-year U.S. and German bond yields tightened. Meanwhile, the highly predictive CME Group fed funds futures are predicting a 79% chance (and rising) of a hike on December 16.
Indeed, perhaps the best idea is to get on with normalizing interest rates, ending the manipulation of monetary stimulus, and focusing instead on taking the heavy hand of government out of the picture and allowing the free market and entrepreneurial spirit to work its magic with greater freedom. Maybe that’s the message of Friday’s big rally in stocks. After all, growth is still struggling to get traction. With the FANG companies (Facebook (FB), Amazon (AMZN), Netflix (NFLX) , and Google (GOOGL)) dominating revenue growth with their disruptive strategies and technologies, everyone else is fighting tooth-and-nail to grab the leftover scraps of growth opportunities. GDP, industrial production, retail sales, shipments and orders of nondefense capital goods, have all been weak. This Friday’s retail sales report could be market moving.
During 3Q2015, with the big news drivers of China’s growth slowdown, a strengthening dollar, and slumping commodity prices, debt issuance in emerging markets declined the most since the end of the financial crisis in 2009, falling almost 80% sequentially (2Q2015) and year-over-year (3Q2014). Emerging market debt is generally dollar-denominated, so a surging dollar has hurt.
Still, the slow growth, low inflation environment should remain favorable for stocks to have at least modest gains into the next quarter. Moreover, unemployment is declining. Household debt is not rising as fast as income. Although the yield curve is not steepening (yet), at least it is far from inverted. There is no recession on the horizon. Nor is there excessive optimism or irrational exuberance. And the Fed remains accommodative, so real interest rates will remain quite low for the foreseeable future. However, the forward P/E for the S&P 500 has reached 17.2x, and further multiple expansion is likely dicey at this point, so further price gains will have to come from top-line growth.
The CBOE Market Volatility Index (VIX), a.k.a. fear gauge, fell 18% on Friday to close below the 15 fear threshold at 14.81, after spiking above 19 on Thursday.
By the way, I am excited to be attending the Inside ETFs 2016(link is external) conference in Hollywood, FL, January 24-27, which has become a premier ETF event. ETF.com has provided me with a discount code to share with advisors who might want to attend: IE16-SM.
SPY chart review:
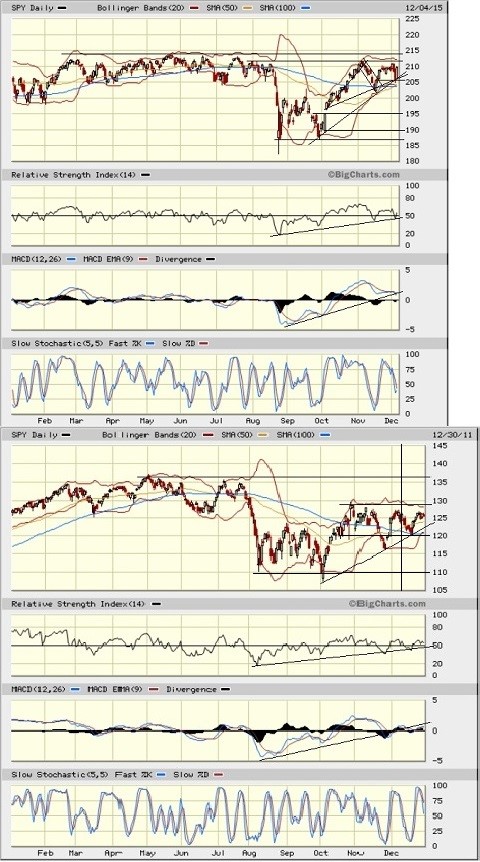
The SPDR S&P 500 Trust (SPY) closed Friday at 209.62, and remains above its 50-day, 100-day, and 200-day simple moving averages. It seems to have entered into a sideways consolidation pattern between 207 and 211. I show a couple of possible uptrend lines that might still be forming a bullish ascending triangle with the line of solid resistance around 211-212, which was the level of the August highs that stopped the October rally. Oscillators RSI, MACD, and Slow Stochastic all appear to be confirming the uptrends and yet seem to be in neutral positions that could support further upside, although a slight caution comes from reduced volume on Friday’s big up day compared with Thursday’s big down day. And with strong overhead resistance and lingering uncertainty ahead of the Fed announcement next week, stocks could churn in place or even drift lower until that issue is resolved. If a breakout occurs, next resistance is the May (and all-time) high near 214, followed by blue skies. Support resides at the 200-day SMA (around 207) and 100-day SMA (around 204), and prior support at 202.50. The 50-day SMA is rising rapidly in an attempt to cross up bullishly through the 200-day SMA.
I couldn’t help but paste the SPY chart from 2011 to the bottom of the current chart because the similarities are startling, including the extended sideways pattern during the first half, the plunge in August, the bounce and retest of lows around the first of October and strong October rally, followed by sideways action. If 2015 ends its last few weeks in the same way, does this mean we can expect the same mega-rally for the ensuing Q1? Time will tell, but it seems unlikely we would get that much power given current valuations and global issues.
Latest sector rankings:
Relative sector rankings are based on our proprietary SectorCast model, which builds a composite profile of each equity ETF based on bottom-up aggregate scoring of the constituent stocks. The Outlook Scoreemploys a forward-looking, fundamentals-based multifactor algorithm considering forward valuation, historical and projected earnings growth, the dynamics of Wall Street analysts’ consensus earnings estimates and recent revisions (up or down), quality and sustainability of reported earnings (forensic accounting), and various return ratios. It helps us predict relative performance over the next 1-3 months.
In addition, SectorCast computes a Bull Score and Bear Score for each ETF based on recent price behavior of the constituent stocks on particularly strong and weak market days. High Bull score indicates that stocks within the ETF recently have tended toward relative outperformance when the market is strong, while a high Bear score indicates that stocks within the ETF have tended to hold up relatively well (i.e., safe havens) when the market is weak.
Outlook score is forward-looking while Bull and Bear are backward-looking. As a group, these three scores can be helpful for positioning a portfolio for a given set of anticipated market conditions. Of course, each ETF holds a unique portfolio of stocks and position weights, so the sectors represented will score differently depending upon which set of ETFs is used. We use the iShares that represent the ten major U.S. business sectors: Financial (IYF), Technology (IYW), Industrial (IYJ), Healthcare (IYH), Consumer Goods (IYK), Consumer Services (IYC), Energy (IYE), Basic Materials (IYM), Telecommunications (IYZ), and Utilities (IDU). Whereas the Select Sector SPDRs only contain stocks from the S&P 500, I prefer the iShares for their larger universe and broader diversity. Fidelity also offers a group of sector ETFs with an even larger number of constituents in each.
Here are some of my observations on this week’s scores:
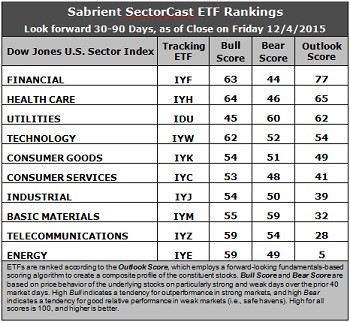
1. Financial has jumped to the top spot this week with an Outlook score of 77. The sector has the lowest forward P/E (about 15.2x) and the best sentiment among both insiders (open market buying) and Wall Street analysts (net revisions to earnings estimates). Notably, Financial is the only sector that can boast net positive revisions (although just barely above zero), as the Street has slowed down its cuts to forward estimates but still shows net reductions for all other sectors. Perhaps analysts expect Financials to finally have a chance to benefit from higher interest rates. Healthcare takes second and displays a solid forward long-term growth rate and return ratios. Utilities, Technology, and Consumer Goods (Staples/Noncyclical) round out the top five, followed by Consumer Services (Discretionary/Cyclical) and an improving Industrial.
2. Energy remains at the bottom with an Outlook score of 5 as the sector scores among the worst in most factors of the GARP model. In particular, stocks within the sector still show a negative forward long-term growth rate and low return ratios, as well as the highest forward P/E (around 22.8x). Telecom takes the other spot in the bottom two with an Outlook score of 28, even though its score didn’t change from last time, as Industrial and Basic Materials rose.
3. Looking at the Bull scores, Healthcare tops the list with a 64, followed closely by Financial at 63, while Utilities is the lowest at 45. The top-bottom spread is 19 points, which reflects low sector correlations on particularly strong market days, which is good. It is generally desirable in a healthy market to see low correlations reflected in a top-bottom spread of at least 20 points, which indicates that investors have clear preferences in the stocks they want to hold (rather than broad risk-on behavior).
4. Looking at the Bear scores, Utilities displays the top score of 60, which means that stocks within this sector have been the preferred safe havens (relatively speaking) on weak market days. Financial scores the lowest at 44 as investors flee these sectors during market weakness. The top-bottom spread is 16 points, which reflects fairly low sector correlations on weak market days, which is good. Ideally, certain sectors will hold up relatively well while others are selling off (rather than broad risk-off behavior), so it is generally desirable in a healthy market to see low correlations reflected in a top-bottom spread of at least 20 points.
5. Financial displays the best all-around combination of Outlook/Bull/Bear scores, followed by Healthcare, while Energy is the worst. However, looking at just the Bull/Bear combination, Basic Materials and Technology tie for the best, indicating superior relative performance (on average) in extreme market conditions (whether bullish or bearish), while Consumer Services (Discretionary/Cyclical) is the worst, probably due to the mixed earnings reports from retailers.
6. This week’s fundamentals-based Outlook rankings remain mostly neutral, with defensive sectors Utilities and Consumer Goods (Staples/Noncyclical) in the top five along with economically-sensitive sectors Technology and Financial, plus all-weather Healthcare. Keep in mind, the Outlook Rank does not include timing, momentum, or relative strength factors, but rather is a reflection of the fundamental expectations of individual stocks aggregated by sector.
Stock and ETF Ideas:
Our Sector Rotation model, which appropriately weights Outlook, Bull, and Bear scores in accordance with the overall market’s prevailing trend (bullish, neutral, or defensive), maintains a bullish bias and suggests holding Financial, Healthcare, and Technology, in that order. (Note: In this model, we consider the bias to be bullish from a rules-based trend-following standpoint when SPY is above both its 50-day and 200-day simple moving averages.)
Other highly-ranked ETFs in SectorCast from the Financial, Healthcare, and Technology sectors include PowerShares KBW Bank Portfolio (KBWB), Market Vectors Pharmaceutical ETF (PPH), and Technology Select Sector SPDR Fund (XLK). Other notable ETFs that are highly ranked in our quant model include US Global Jets ETF (JETS), which is mostly airlines, plus the Direxion All Cap Insider Sentiment Shares (KNOW), which tracks a Sabrient index, and the First Trust LongShort Equity ETF (FTLS), which employs an absolute return strategy that licenses our Earnings Quality Rank (a quant model we developed together with our forensic accounting subsidiary Gradient Analytics).
For an enhanced sector portfolio that enlists some top-ranked stocks (instead of ETFs) from within the top-ranked sectors, some long ideas from Financial, Healthcare, and Technology sectors include Capital One Financial (COF), JP Morgan Chase (JPM), AmerisourceBergen (ABC), Shire plc (SHPG), Verisign (VRSN), and Alphabet (GOOGL). All are highly ranked in the Sabrient Ratings Algorithm and also score among the top two quintiles (lowest accounting-related risk) of our Earnings Quality Rank (a.k.a., EQR), a pure accounting-based risk assessment signal based on the forensic accounting expertise of Sabrient subsidiary Gradient Analytics.
If you prefer to take a neutral bias, the Sector Rotation model suggests holding Financial, Healthcare, and Utilities, in that order. But if you prefer a defensive stance on the market, the model suggests holding Utilities, Basic Materials, and Technology, in that order.
Disclosure: Author has no positions in stocks or ETFs mentioned.
Disclaimer: This newsletter is published solely for informational purposes and is not to be construed as advice ...
more

