
Saturday Charts - The Longer View
The Long-Term Outlook
The ECRI index is pointing higher again after briefly touching the zero-level. This is definitely good news.
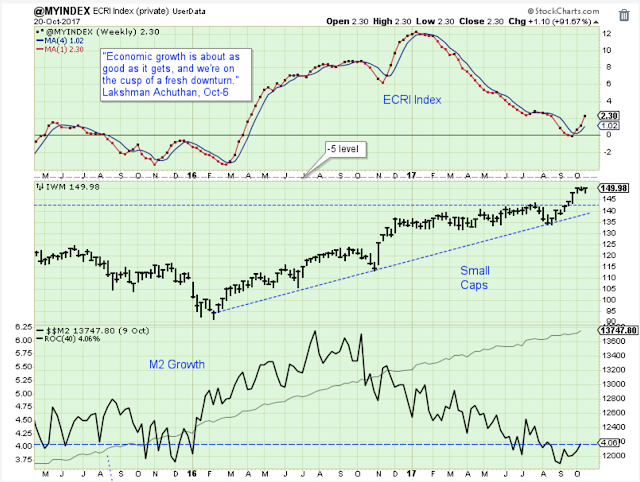
Here is a basic look at the US stock market. Lately I have been using these simple charts to guide me.

Here is another basic chart. It does have the look of a market getting ahead of itself, but it should help us ride the trend higher until it is over.

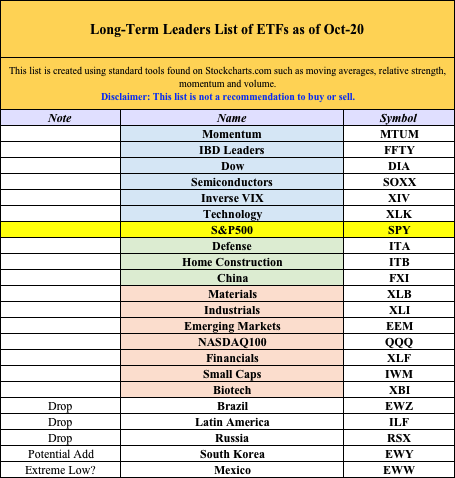
The Long-Term Leader List
This is the weekend long-term list, not the short-term list shown during the week. It is my attempt to trade less frequently. The strongest ETFs are blue, the additional leaders are green and the weakest are red. The S&P500 is the benchmark. Disclaimer: This list is not a recommendation to buy or sell.
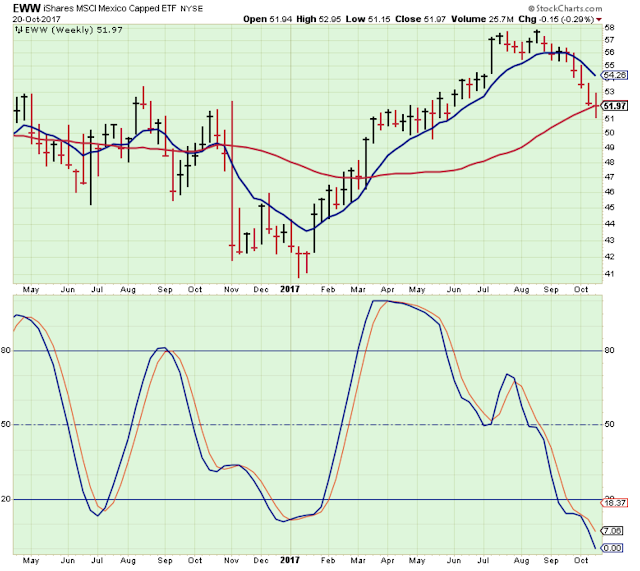
Brazil, Russia and Latin America have been dropped. They look like they are rolling over. South Korea looks like a potential add, and Mexico is so oversold and negative that maybe it is a contrarian play.
First, let's look at the ETFs that have been dropped. The stochastic is pointing down for ILF and EWZ.

ILF and EWZ look similar.

Russia is struggling.

Mexico is an interesting contrarian play. Maybe I will wait, though, until it shows a little strength.
Outlook
The ECRI index had been pointing to weak economic growth in the months ahead, but the index has now bottomed out and is pointing higher again.
- The long-term outlook is improving.
- The medium-term trend is up. The best period for buying is past.
- The short-term trend is up.
Disclaimer: I am not a registered investment advisor. My comments above reflect my view of the market, and what I am doing with my accounts. The analysis is not a ...
more

