
Rising Interest Rates And The Term Premium
Last week I puzzled over the response of financial markets to the U.S. election. Since the election, the S&P 500 is now up 3%, the dollar is up 4.6% against the euro, and most remarkable of all, the 10-year Treasury rate has gone up 50 basis points. Here I offer some further thoughts on the last development.
In normal times you would expect to earn a higher return from long-term bonds compared to short-term as an added compensation for being exposed to various risks. Over the last half century, the yield on 10-year Treasury bonds averaged 1.56 percentage points (or 156 basis points) higher than 3-month Treasury bills. But while the 10-year rate is up 50 basis points since the election, the 3-month rate has only risen 4 basis points. What we’ve seen is a rapid increase in the spread between long and short rates and a sharp steepening of the yield curve.
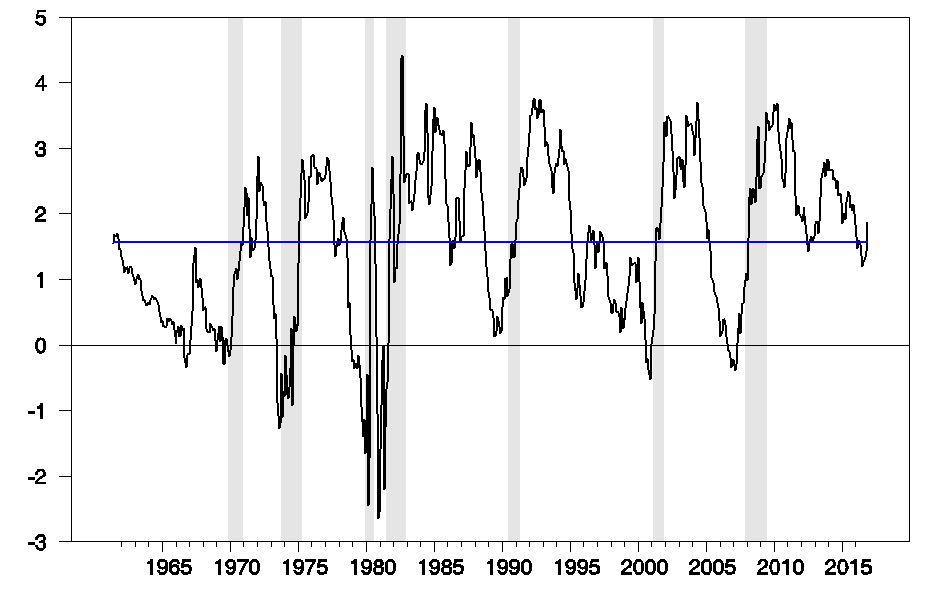
Yield on 10-year Treasury bonds minus that on 3-month Treasury bills, monthly June 1961 to Nov 2016. Blue line corresponds to average historical spread of 156 basis points.
In some historical episodes, short-term securities have a higher yield than long-term and the yield curve becomes inverted. These brief episodes of a negative spread usually come near the end of an episode of tightening short-term rates. If investors anticipate falling interest rates, an anticipated capital gain on a long-term bond can help compensate for the fact that its current yield is less than that on a 3-month T-bill.
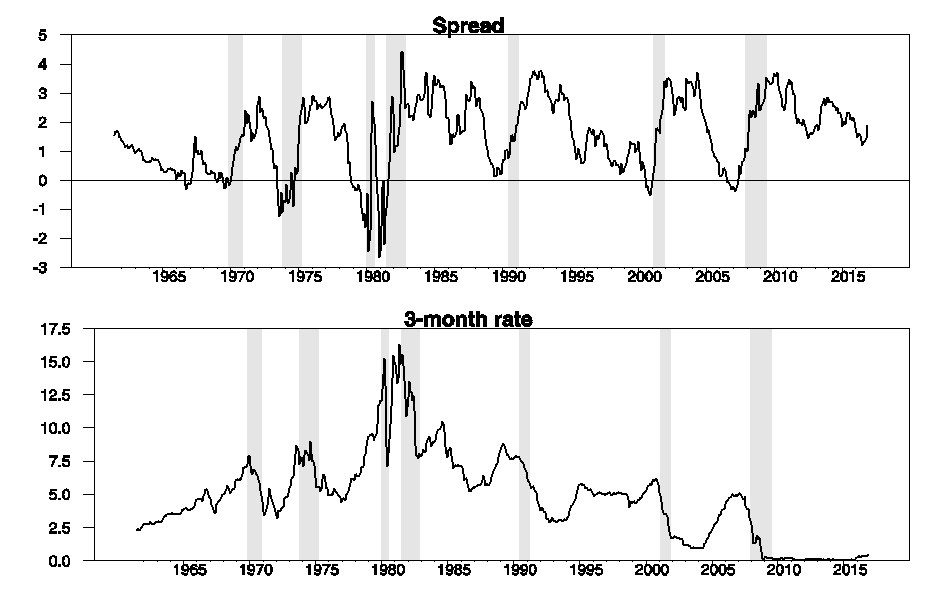
Top panel: Spread between 10-year and 3-month yields. Bottom panel: 3-month yield.
In principle it should be possible to calculate how much of the movement in the spread represents a changing assessment of future short-term rates and how much is a change in the premium earned for holding long-term bonds. If we have a model for forecasting short-term rates, we could calculate how much the spread should change due to the first factor, and attribute the difference between the actual spread and the predicted spread to changes in the term premium. Of course, the answer one arrives at can be quite sensitive to the model usedfor forecasting. Below is a graph of one popular estimate of the term premium.
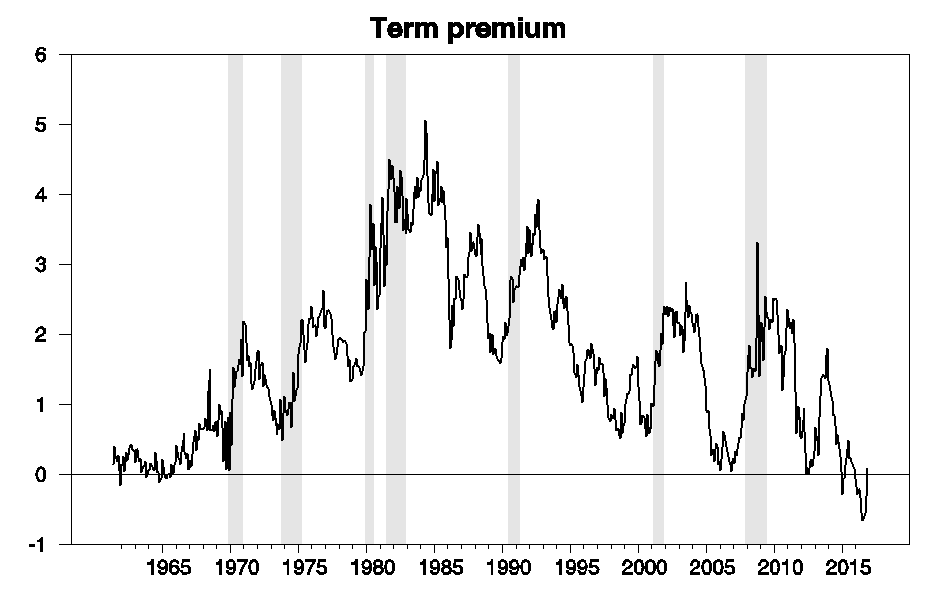
Estimate of term premium on 10-year Treasury bonds based on the Adrian, Crump, and Moench model.
This series suggests that we have just emerged from an unusually long episode in which the term premium was actually negative, that is, an episode in which investors could anticipate higher returns from T-bills compared to Treasury bonds. Meager as the T-bill yield was, it was a better deal than taking a capital loss on long-term bonds, which would be the likely outcome once interest rates returned to something more in the normal historical range.
What could account for such a negative term premium? One big risk weighing on some investors recently has been the possibility that the U.S. might be about to enter a Japanese-style prolonged deflationary slump, with real interest rates near zero or even negative for the foreseeable future. Even if that is not the most likely outcome, it was a possibility against which investors might want some insurance. Long-term bonds are the one asset that would do well if that dismal scenario should unfold, which could have been one reason investors were willing to accept a lower expected yield for holding long-term bonds– the one state of the world in which they do well is the state in which you really want to have some extra money.
If this interpretation is correct, it means that the market views a protracted deflationary slump as significantly less likely than it had seemed three weeks ago. There has been some favorable economic news over this period. Positive reports for retail sales and housing starts have helped lift the Federal Reserve Bank of New York’s estimate of 2016:Q4 GDP growth rate from 1.6% on November 4 to 2.5% today, while the Federal Reserve Bank of Atlanta’s estimate has gone from 3.1% to 3.6%.
But the biggest news would seem to be the election outcome, which raised the prospects of significant fiscal stimulus. I think we’re likely to see both tax cuts and spending increases passed relatively quickly by the new Congress and signed into law by the new President. While that could raise some other concerns, a prolonged deflationary slump isn’t one of them.
Disclosure: None.


