
Richmond Fed Manufacturing: June Composite Index Improves
Today the Richmond Fed Manufacturing Composite Index increased 6 points to 7 from last month's 1. Investing.com had forecast 4. Because of the highly volatile nature of this index, we include a 3-month moving average to facilitate the identification of trends, now at 9.3, indicates expansion. The complete data series behind today's Richmond Fed manufacturing report, which dates from November 1993, is available here.
Here is a snapshot of the complete Richmond Fed Manufacturing Composite series.

Here is the latest Richmond Fed manufacturing overview.
Reports from Fifth District manufacturers improved in June, according to the latest survey by the Federal Reserve Bank of Richmond. The composite manufacturing index rose from 1 in May to 7 in June, as the indexes for shipments and new orders increased. The employment index was relatively flat. Most firms continued to report steady or higher wages; although the index for wages did fall in June, it remained above 0. Meanwhile, more firms reported a decline in the average workweek than reported an increase.
Looking six months ahead, manufacturing executives were more optimistic in June than in May, although even the May readings were very positive. Among the indexes for expected activity, only two fell: the capital expenditures index declined from 34 in May to 26 in June and the expected shipments metric inched down from 39 to 38.
Survey responses pointed toward more moderate growth in both prices paid and prices received. Expected growth in prices received also moderated, although expected growth in prices paid picked up somewhat. Link to Report
Here is a somewhat closer look at the index since the turn of the century.

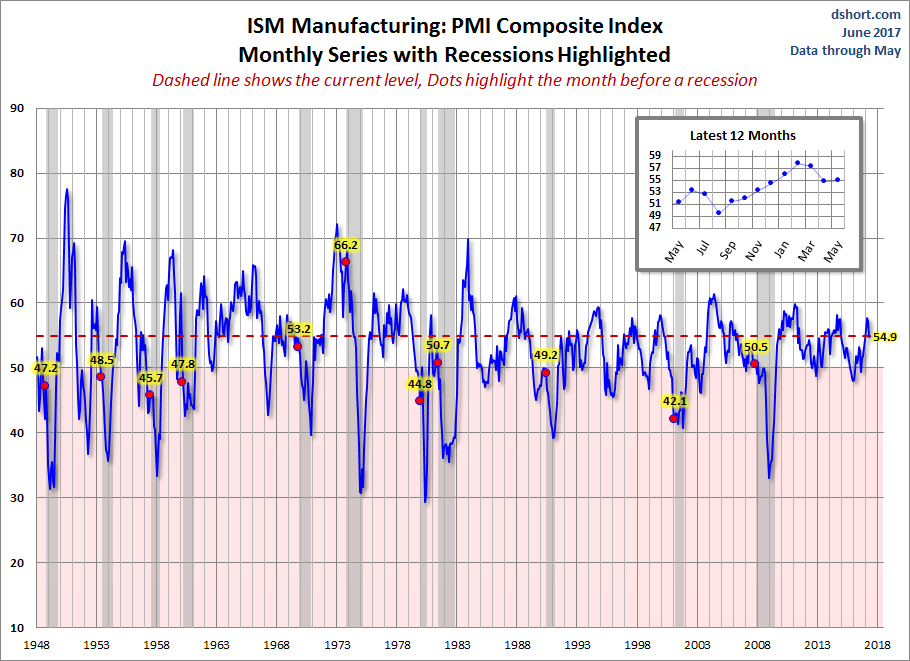
Is today's Richmond composite a clue of what to expect in the next PMI composite? We'll find out when the next ISM Manufacturing survey is released (below).
Because of the high volatility of this series, we should take the data for any individual month with the proverbial grain of salt.
Let's compare all five Regional Manufacturing indicators. Here is a three-month moving average overlay of each since 2001 (for those with data).

Here is the same chart including the average of the five.

Disclosure: None.


