
Renewable Is The Market's New Sustainable
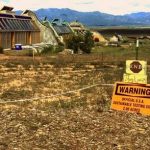
Earth Ships, Taos NM
“Sustainable Testing Site” brings up three questions about last week’s market action.
Can the market indices sustain the recent rally in price?
Have sustainable or renewable energy instruments finally bottomed?
How, if at all, might the relationship between the indices and renewables affect one another?
The sign in the photo also spells out “WARNING” in bold letters. What exactly is sustainable testing anyway? O.K. a fourth and perhaps totally beside the point question.
While many of the solar and wind energy stocks test a bottom, the overall market flashed another warning.
Nasdaq and the Russell 2000 are in bullish phases. The Dow and S&P 500 are in warning phases. Will renewed buying in renewables help resolve the overall market’s next big move?
The answers to those questions begin with an assumption that First Solar, Canadian Solar and if we look more broadly, TAN, the solar ETF did indeed bottom.
We can assume there is a high probability that a bottom is in because of classic indicators. One, TAN made a new 60 + day low followed by a high volume rally. Two, the rally confirmed on Friday. Furthermore, TAN’s nadir low in June was 19.02. Last week’s low of 19.40, makes a case for a double bottom.
Also noteworthy is the typical relationship between oil and renewables. Cheap oil trumps the demand for alternative energy sources. Oil is cheap. Solar is cheaper. That makes me wonder whether TAN is just playing catch up to oil, both of which are still very cheap. Or, is TAN telling us that USO, the ETF, is getting ready to power higher.
Which brings me back to the potential relationship between solar, oil and the overall market.
No doubt the market’s ability to sustain a rally was tested in the weaker Modern Family members. Although the Russell 2000 closed higher on the week, it could not sustain last Thursday’s euphoric move.
Retail, our dear old Granny, closed in the middle of a very important trading range. That keeps us watching her closely.
Trannies closed better than Granny, but equally indecisive. Regional Banks fared a bit better. Semiconductors look toppy after having the largest percentage decline right after making new highs. And Big Brother Biotechnology could not hold 300. A Modern Family goulash.
The sign in the photo also says “End” and “Thank You.” If the oil and alternative energy markets emerge from their pits, the market could once and for all say this is the “end” of testing its ability to sustain rallies.
Why? Because those waiting for signs of growing global demand and higher inflation can finally say “Thank you.”
S&P 500 (SPY) Could not close a second day above 216.94 to confirm a bullish phase so back in warning.
Russell 2000 (IWM) 124.50 pivotal.
Dow (DIA) Doubtful it will test 180 again. Or better yet, not good if it does.
Nasdaq (QQQ) No runaway gap. 118.00 pivotal support
XLF (Financials)
KRE (Regional Banks) 41.30 the 50 DMA to defend and need to see it clear 42.30 area on a closing basis.
SMH (Semiconductors) 66.30 a good level to hold if Friday’s selloff was just long liquidation
IYT (Transportation) 144-146 the resistance to clear
IBB (Biotechnology) 300 pivotal
XRT (Retail) Still need to see a move over 44.17
IYR (Real Estate) Wild day Friday. But I like the action
ITB (US Home Construction) 28 important level to clear
GLD (Gold Trust) 127.20 the 50 DMA support
SLV (Silver) Closed over the 200-week MA. Bullish
GDX (Gold Miners) 27 support 29 next resistance
USO (US Oil Fund) The best thing? The weekly MA gets closer and closer
TAN (Guggenheim Solar Energy) A real chance for a double bottom in the works
TLT (iShares 20+ Year Treasuries) 136 pivotal
UUP (Dollar Bull) Until it closes over 25 or under 24.60 I’m neutral
Disclosure: None.


