
Remeasuring The ‘Dollar’ Shortage For All Q3
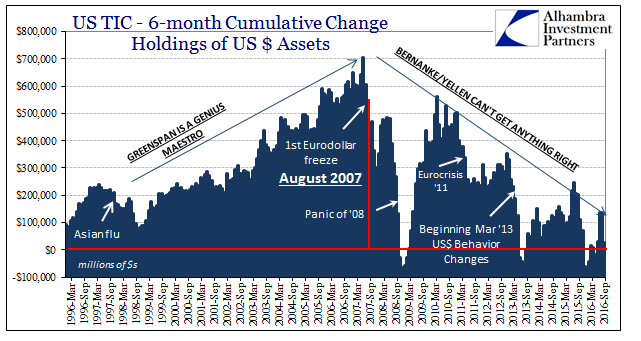
The Treasury Department’s Treasury International Custody (TIC) estimates for September were released, and though I wish they were timelier they do typically confirm what we suspect about the months at each update. There were negatives all over this latest month, including private flows, which would fit the overall narrative where Chinese money markets were all over the place and repo markets in US$’s were a solid mess into and even after quarter end.
Overall, net accumulations of US$ assets were -$46.6 billion, the most total “selling” since April. On the private side, foreign holders disposed of $31 billion in US Treasuries, though buying on net $23.9 billion in agency debt. That leaves it unsettled as to whether the action in UST was related to the overall bond selloff into September, or whether it was the usual liquidations driven by “dollar” considerations. Private buying overall has been unusually strong of agency paper since March.
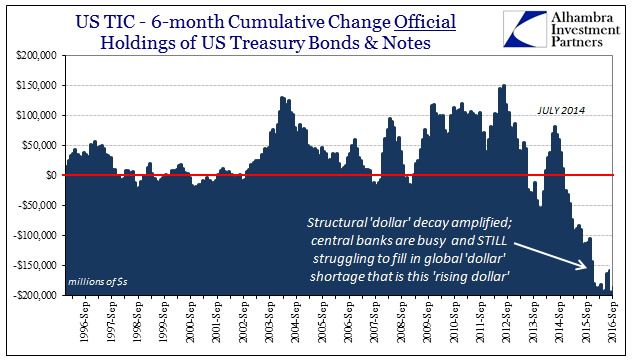
The official sector, on the other hand, continues to operate under clear and great strain. The negatives for September matched those from August; -$35.7 billion overall in September vs. -$38.5 billion the month prior; in just UST’s, -$45.6 billion vs. -$44.2 billion. Since October 2014, TIC records a massive $563 billion in net “sales” of UST’s, suggesting an enormous “dollar” funding gap that foreign central banks have increasingly this year been drawn into.
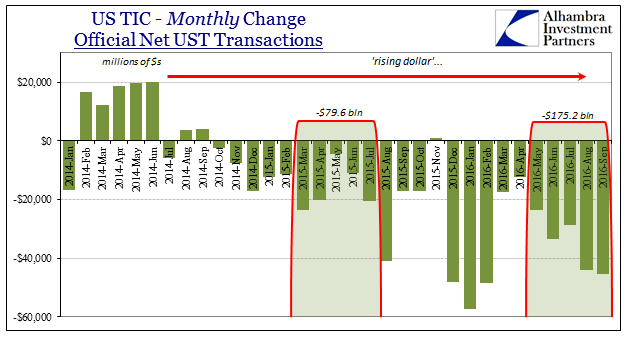
In just the past five months (thru September), the official sector has disposed of (in whatever way) $175 billion in UST assets. That compares to almost $80 billion in the five months before the August 2015 fireworks. It seems quite clear that the difference between this year and last year is that overseas central banks aren’t simply content to take Janet Yellen (or Stanley Fischer) at her word about resilience and sufficient liquidity.
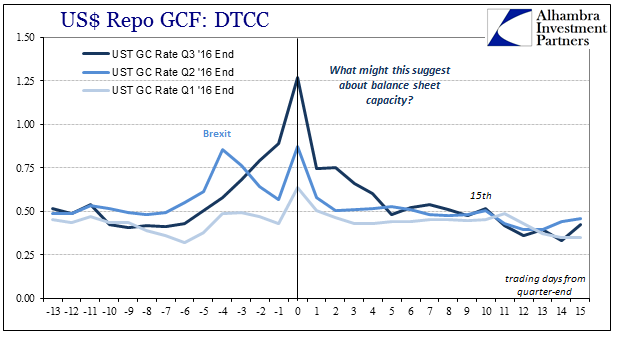
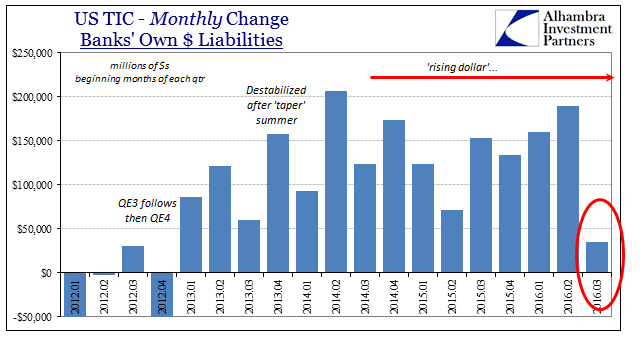
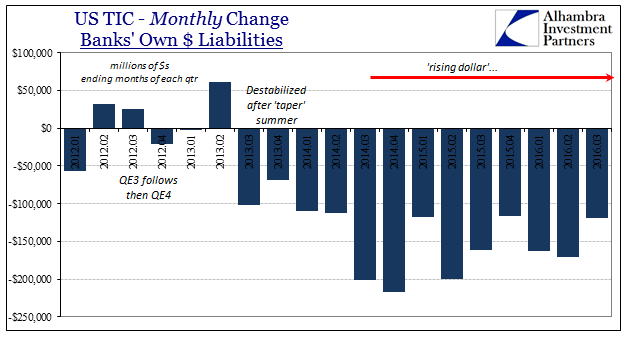
What is most helpful about the TIC data is, as usual, its proxy on bank liabilities. There had been an established quarterly pattern dating back to the summer 2013 “dollar” problems where banks would initiate huge window dressings in the last month of each quarter, only to undo some or all of it the start to the next one. In July 2016, however, though Q2 2016 ended with the usual drawdown of “dollar” liabilities, -$171 billion, there was an extremely limited refill. Reported liabilities only increased $35 billion in July, far below what has been normal, nothing like April.
That was certainly a hint that “dollar” conditions might have appreciably tightened, which is what swap spreads and other money market indications were telling us especially by August. We cannot distinguish why that may have been, but the timing could suggest either a Brexit hangover or, as I suspect, a relation to BoJ activities then.
The latest figures through September show that the drawdown to end Q3 was on the light side but not really out of the typical range, which may have been simply because there was so little build up in the quarter to start with.
In total, then, Q3 looks to have been as bad as prior quarters preceding some of the worst “dollar” conditions. Total “dollar” bank liabilities were reported to have dropped by $62 billion last quarter, almost ten times the decline in Q2. That decline matches with Q4 2015, just prior to the second global liquidation, as well as Q2 2015 just prior to the first one, and Q4 2014 just prior to the first overseas (and commodity) “dollar” disruptions.
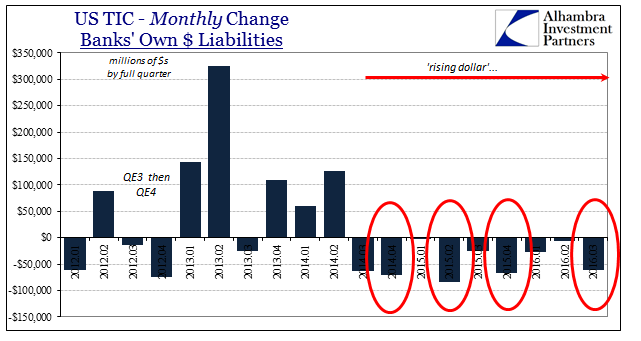
That would all seem to confirm the more drastic interpretations of global “dollars” especially in September and how that might have transferred (China) into Q4. Perhaps more important is what we make of the usual quarterly pattern of Q3. Is it an anomaly, or just the unusual nature of the global financial world of today as conditions constantly evolve? I will note that the arrangement of bank liabilities in Q3 2016 is quite similar to the one in Q2 2015, which does include other similarities as well – “dollar” problems seeming to have been more an overseas concern, whereas the US domestic situation appeared (to many) to be at that time improving markedly.

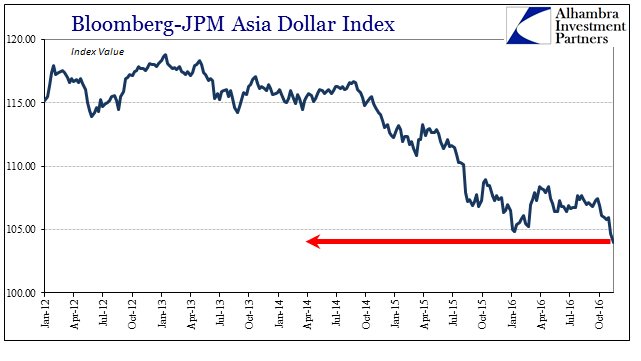
That comparison does not mean we should expect then a repeat of Q3 2015, including the events of that August, only that we can further appreciate China’s obvious struggle with CNY (and RMB) and more so how that might have turned toward the “rising dollar” all over again in other EM currencies. It would most likely apply to those in Asia tied to whatever Asian “dollar.”
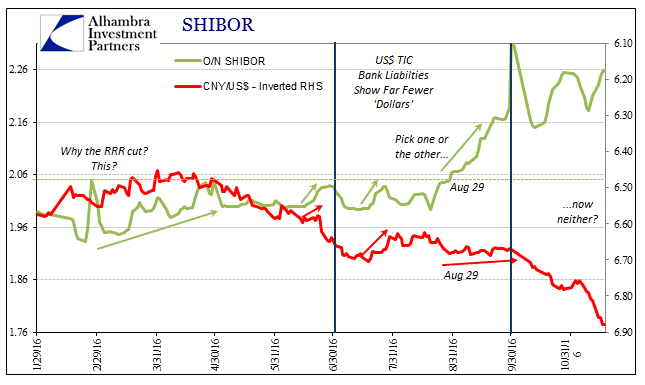
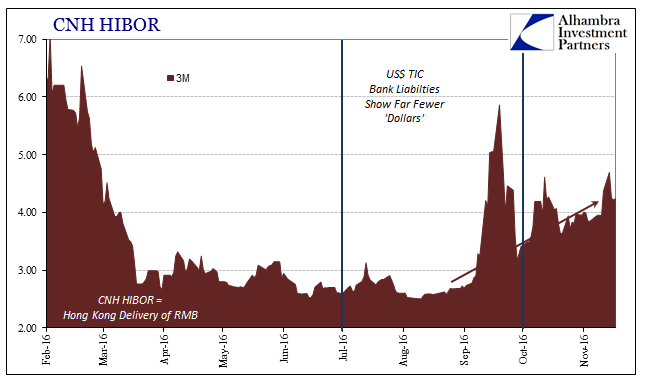
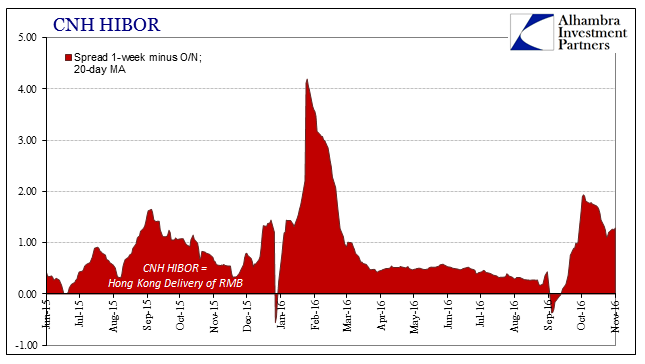
This is where more timely data would be especially helpful. Having corroborated what we suspected about the summer, the growing “dollar” shortage indicated practically everywhere, updated, real-time figures for autumn could aid in clarifying what to expect about how it all might go moving toward winter. Since that isn’t going to happen we will have to continue to get by with the usual indirect “dollar” indications, those of China; CNY, SHIBOR, and HIBOR.
Disclosure: This material has been distributed for ...
more

