
Rating And Ranking The Dow
We can use our data to track individual stocks, industries, sectors, and indices. For today's bulletin, we present key metrics for the Dow Jones Industrials. Only ten of the components currently have a BUY rating. They are presented below according to their one-month forecast target prices.
|
Ticker |
Company Name |
Market Price |
Valuation |
Last 12-M Retrn |
1-M Forecast Retn |
1-Yr Forecast Retn |
P/E Ratio |
Sector Name |
|
TRAVELERS COS |
112.83 |
9.40% |
11.93% |
1.04% |
12.45% |
10.34 |
Finance |
|
|
APPLE INC |
120.57 |
0.14% |
11.64% |
0.97% |
11.64% |
13.01 |
Computer and Technology |
|
|
GOLDMAN SACHS |
196.76 |
2.77% |
3.56% |
0.92% |
10.98% |
10.87 |
Finance |
|
|
CISCO SYSTEMS |
28.18 |
4.76% |
15.16% |
0.90% |
10.82% |
14.02 |
Computer and Technology |
|
|
JPMORGAN CHASE |
67.39 |
13.85% |
11.43% |
0.86% |
10.30% |
12.16 |
Finance |
|
|
INTL BUS MACH |
135.31 |
-22.09% |
-17.69% |
0.68% |
8.11% |
8.70 |
Computer and Technology |
|
|
UNITEDHEALTH GP |
114.26 |
3.34% |
20.26% |
0.61% |
7.25% |
18.12 |
Medical |
|
|
BOEING CO |
145.98 |
4.03% |
16.87% |
0.59% |
7.06% |
17.47 |
Aerospace |
|
|
PFIZER INC |
33.65 |
21.96% |
12.35% |
0.55% |
6.61% |
15.30 |
Medical |
|
|
VERIZON COMM |
45.3 |
-5.43% |
-9.85% |
0.54% |
6.47% |
11.72 |
Utilities |
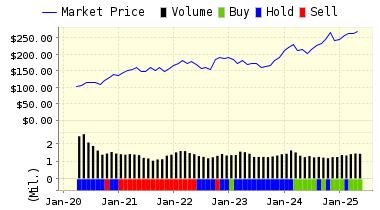
Below is today's data on Traveler's Insurance (TRV):
St. Paul Travelers is a leading provider of commercial property-liability insurance and asset management services. Under the Travelers brand, the company is also a leading underwriter of homeowners and auto insurance through independent agents.
VALUENGINE RECOMMENDATION: ValuEngine continues its BUY recommendation on TRAVELERS COS for 2015-11-09. Based on the information we have gathered and our resulting research, we feel that TRAVELERS COS has the probability to OUTPERFORM average market performance for the next year. The company exhibits ATTRACTIVE Company Size and Sharpe Ratio.
You can download a free copy of detailed report on TRV from the link below.
|
ValuEngine Forecast |
||
|
Target |
Expected |
|
|---|---|---|
|
1-Month |
114.00 | 1.04% |
|
3-Month |
116.75 | 3.47% |
|
6-Month |
119.99 | 6.35% |
|
1-Year |
126.88 | 12.45% |
|
2-Year |
130.04 | 15.26% |
|
3-Year |
134.57 | 19.26% |
|
Valuation & Rankings |
|||
|
Valuation |
9.40% overvalued |
Valuation Rank |
|
|
1-M Forecast Return |
1.04% |
1-M Forecast Return Rank |
|
|
12-M Return |
11.93% |
Momentum Rank |
|
|
Sharpe Ratio |
0.79 |
Sharpe Ratio Rank |
|
|
5-Y Avg Annual Return |
14.31% |
5-Y Avg Annual Rtn Rank |
|
|
Volatility |
18.04% |
Volatility Rank |
|
|
Expected EPS Growth |
-12.25% |
EPS Growth Rank |
|
|
Market Cap (billions) |
37.39 |
Size Rank |
|
|
Trailing P/E Ratio |
10.34 |
Trailing P/E Rank |
|
|
Forward P/E Ratio |
11.79 |
Forward P/E Ratio Rank |
|
|
PEG Ratio |
n/a |
PEG Ratio Rank |
|
|
Price/Sales |
1.39 |
Price/Sales Rank |
|
|
Market/Book |
1.85 |
Market/Book Rank |
|
|
Beta |
1.12 |
Beta Rank |
|
|
Alpha |
0.08 |
Alpha Rank |
|
Valuation Watch: Overvalued stocks now make up 50.37% of our stocks assigned a valuation and 19.05% of those equities are calculated to be overvalued by 20% or more. Nine sectors are calculated to be overvalued--with one overvalued by double digits.
Disclosure: None.
Disclaimer: ValuEngine.com is an independent research provider, producing buy/hold/sell recommendations, target price, and valuations on over 7,000 US and Canadian equities ...
more

