
Rankings Take A Defensive Turn As Bulls Lack A Suitable Catalyst To Sustain A Rally
As a rather uninspiring earnings season starts to wind down, bullish investors eager for a significant catalyst from company reports instead have been left a bit flat-footed and disheartened. With consumer sentiment and retail sales flagging in key overseas markets like Europe and China, global capital continues to flow into the safety of U.S. Treasuries, driving down bond yields despite a supposedly imminent fed funds rate hike. Furthermore, given narrow market breadth, high equity correlations, a tenuous technical picture (especially small caps), and a defensive turn in Sabrient’s fundamentals-based quant rankings, there seems little reason for bulls to get pumped up about jumping back into equities at the moment. Nevertheless, the longer term direction is still up.
In this weekly update, I give my view of the current market environment, offer a technical analysis of the S&P 500 chart, review our weekly fundamentals-based SectorCast rankings of the ten U.S. business sectors, and then offer up some actionable trading ideas, including a sector rotation strategy using ETFs and an enhanced version using top-ranked stocks from the top-ranked sectors.
Market overview:
With 80% of S&P 500 companies having reported, the conclusion is that both revenues and earnings are down from the same quarter last year. On the other hand, about 70% of those who have reported beat earnings expectations, and if you strip out the anomalous Energy sector, the other sectors in aggregate display reasonably good growth in both revenues and earnings. In particular, auto sales have been scorching hot. And of course, Healthcare has been by far the best performing sector.
Economic reports show continued improvement. Unemployment claims have remained below 300,000 for 21 weeks (which is less than 0.2% of total jobs), and Friday's jobs report showed that the number of full-time jobs as a share of total employment rose to 81.7% (which is the highest level since November 2008). ISM services index came in at 60.3, which is up from 56.0 last month, and it is the highest reading in 10 years (and only the third time above 60 in 15 years). Moreover, the New Orders component reads 63.8, which is promising for the future. The trade deficit widened by 7.1% in June to $43.8 billion, as imports rose while exports fell, which could lead to downward revisions to GDP in the future.
ConvergEx recently noted that fed funds futures are signaling virtually no chance of a hike in September. And with the 10-year Treasury yield closing Friday at 2.17% and the 30-year at 2.83%, global investors continue to buy up Treasuries (therefore driving down rates) and clearly have no fear of any near-term jolt in interest rates that would kill the value of their bond holdings. On the other hand, many economists and commentators (notably including Bill Gross) are predicting a September hike -- even suggesting that the Fed must act. My view is that the Fed cannot afford to raise rates right now given that weak commodities markets and a strong dollar have put us on the verge of deflation. Higher rates would further strengthen the dollar. But even if the Fed does make a token 0.25% increase in September or December, it is highly unlikely that a rapid sequence of increases will ensue. Indeed, we might not see another one through 2016.
The CBOE Market Volatility Index (VIX), a.k.a. fear gauge, closed last Friday at 13.39, which is back below the 15 fear threshold and well below the 20 panic threshold that has held as resistance throughout the summer. But despite the general complacency, there seems to be little in the way of rationale motivating investors to move significantly into risk assets.
As most of my readers know, Sabrient has published each January since 2009 our annual Baker’s Dozentop picks list for the coming year, based on our proven growth-at-a-reasonable-price (aka, GARP) model. Well, on Thursday this week we are introducing our first mid-year Baker’s Dozen top picks list, which like the January portfolio will be offered through First Trust Portfolios as a unit investment trust.
SPY chart review:
The SPDR S&P 500 Trust (SPY) closed Friday at 207.95, which is right about where it closed two weeks prior, when I last posted an article. In other words, not much has happened. It has been a long-term consolidation, with the 50-day and 100-day simple moving averages converging together, and the 200-day not far below. Once again, SPY is probing solid support at the important 200-day SMA. The bearish triple-top formation is indeed playing out to the downside for the large cap index, and with market breadth so narrow, the small cap Russell 2000 is looking even more vulnerable to further downside as its head-and-shoulders pattern continues to play out. In fact, small caps appear to be staring at the edge of a cliff right now. For SPY, its oscillators RSI, MACD, and Slow Stochastic are all in a somewhat neutral position right now and could go either way. But if we just focus on the candlestick formations, Friday’s bullish hammer might be indicating that a temporary bounce is nigh. Major support is just below at the critical 200-day SMA (which is still rising bullishly), followed by recent support around 204-205, then round-number support at the 200 price level.
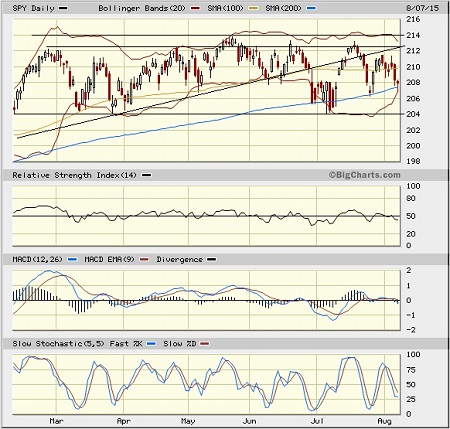
The long-standing bullish uptrend line shown make have given way for good, as this ultra-long sideways consolidation period (ever since the February bounce to new highs) plays out, with a nominal range bounded by 204 on the bottom and 212-214 at the top -- and we are currently smack dab in the middle of it, looking for direction. Some technicians have observed that this is the longest such consolidation period since the 1950s.
Latest sector rankings:
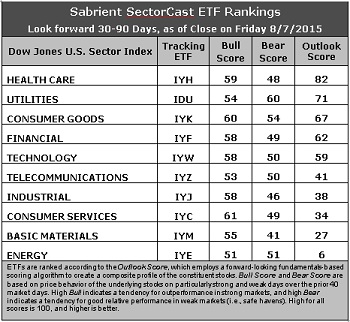
Relative sector rankings are based on our proprietary SectorCast model, which builds a composite profile of each equity ETF based on bottom-up aggregate scoring of the constituent stocks. The Outlook Scoreemploys a forward-looking, fundamentals-based multifactor algorithm considering forward valuation, historical and projected earnings growth, the dynamics of Wall Street analysts’ consensus earnings estimates and recent revisions (up or down), quality and sustainability of reported earnings (forensic accounting), and various return ratios. It helps us predict relative performance over the next 1-3 months.
In addition, SectorCast computes a Bull Score and Bear Score for each ETF based on recent price behavior of the constituent stocks on particularly strong and weak market days. High Bull score indicates that stocks within the ETF recently have tended toward relative outperformance when the market is strong, while a high Bear score indicates that stocks within the ETF have tended to hold up relatively well (i.e., safe havens) when the market is weak.
Outlook score is forward-looking while Bull and Bear are backward-looking. As a group, these three scores can be helpful for positioning a portfolio for a given set of anticipated market conditions. Of course, each ETF holds a unique portfolio of stocks and position weights, so the sectors represented will score differently depending upon which set of ETFs is used. We use the iShares that represent the ten major U.S. business sectors: Financial (IYF), Technology (IYW), Industrial (IYJ), Healthcare (IYH), Consumer Goods (IYK), Consumer Services (IYC), Energy (IYE), Basic Materials (IYM), Telecommunications (IYZ), and Utilities (IDU). Whereas the Select Sector SPDRs only contain stocks from the S&P 500, I prefer the iShares for their larger universe and broader diversity. Fidelity also offers a group of sector ETFs with an even larger number of constituents in each.
Here are some of my observations on this week’s scores:
1. Healthcare remains in the top spot with an Outlook score of 82, primarily due to highly favorable sentiment among Wall Street analysts (net upward revisions to earnings estimates), solid return ratios, and a strong forward long-term growth rate, although its forward P/E remains pricey. Financial falls to fourth this week, and Utilities moves up to second with a score of 71, primarily due to good sell-side support and a low forward P/E. Consumer Goods (Staples/Noncyclical) moves into third place with a score of 67, making a defensive top three. Financial and Technology round out the top five, followed by a surging Telecom, which rose 24 points in its Outlook score, largely due to a big jump in both analyst and insider sentiment (i.e., Wall Street upward revisions and insider buying activity).
2. Energy remains at the bottom with an Outlook score of 6. Energy scores poorly in most factors of the GARP model across the board. In particular, Wall Street continues to slash estimates, and yet the sector still displays by far the highest forward P/E and a negative forward long-term growth rate. Basic Materials takes the other spot in the bottom two with a 27. Even though the sector displays one of the lowest forward P/Es, Wall Street continues to slash estimates.
3. Looking at the Bull scores, Consumer Services (Discretionary/Cyclical) displays the top score of 61, followed by the other consumer sector, Consumer Goods (Staples/Noncyclical). Energy has the lowest Bull score of 51. The top-bottom spread is only 10 points, reflecting high sector correlations on particularly strong market days (i.e., broad risk-on buying). It is generally desirable in a healthy market to see low correlations reflected in a top-bottom spread of at least 20 points, which indicates that investors have clear preferences in the stocks they want to hold.
4. Looking at the Bear scores, Utilities displays the top score of 60, followed by Consumer Goods (Staples/Noncyclical) at 54, which means that stocks within these sectors have been the preferred safe havens (relatively speaking) on weak market days. Basic Materials scores the lowest at 41. The top-bottom spread is 19 points, which reflects low sector correlations on particularly weak market days, which is good. Ideally, certain sectors will hold up relatively well while others are selling off, so it is generally desirable in a healthy market to see low correlations reflected in a top-bottom spread of at least 20 points.
5. Healthcare displays the best all-around combination of Outlook/Bull/Bear scores, followed by Utilities, while Energy is clearly the worst. Looking at just the Bull/Bear combination, Utilities and Consumer Goods (Staples/Noncyclical) are tied for the highest, indicating superior relative performance (on average) in extreme market conditions (whether bullish or bearish), while Basic Materials is the worst.
6. Overall, this week’s fundamentals-based Outlook rankings have turned defensive, with all-weather Healthcare and defensive sectors Utilities and Consumer Goods (Staples/Noncyclical) as the top three. Even Telecom has risen ahead of Industrial and Consumer Discretionary, while Basic Materials and Energy are mired at the bottom due to expected persistence of low commodities prices. Notably, cyclical sectors like Industrial, Tech, and Financial lately have been taking the brunt of the Street’s downward earnings revisions. Keep in mind, the Outlook Rank does not include timing or momentum factors, but rather is a reflection of the fundamental expectations of individual stocks aggregated by sector.
Stock and ETF Ideas:
Our Sector Rotation model, which appropriately weights Outlook, Bull, and Bear scores in accordance with the overall market’s prevailing trend (bullish, neutral, or defensive), still reflects a neutral bias and suggests holding Healthcare, Utilities, and Consumer Goods (Staples/Noncyclical), in that order. (Note: In this model, we consider the bias to be neutral from a rules-based trend-following standpoint when SPY is below its 50-day but still above its 200-day simple moving average.)
Other highly-ranked ETFs in SectorCast from the Healthcare, Utilities, and Consumer Goods (Staples/Noncyclical) sectors include iShares Global Healthcare ETF (IXJ), Guggenheim Invest S&P 500 Equal Weight Utilities ETF (RYU), and PowerShares DWA Consumer Staples Momentum Portfolio (PSL). Notably, the two equity ETFs with the highest Outlook scores in our system are both heavily weighted in airlines -- the SPDR S&P Transportation ETF Trust (XTN) and the US Global Jets ETF (JETS).
For an enhanced sector portfolio that enlists some top-ranked stocks (instead of ETFs) from within the top-ranked sectors, some long ideas from Healthcare, Utilities, and Consumer Goods (Staples/Noncyclical) sectors include Thermo Fisher Scientific (TMO), Cigna Corp (CI), Eversource Energy (ES), Level 3 Communications (LVLT), Helen of Troy Ltd (HELE), and Chemed Corp (CHE). All are highly ranked in the Sabrient Ratings Algorithm.
If you prefer to play a bounce and maintain a bullish bias, the Sector Rotation model suggests holding Healthcare, Consumer Goods (Staples/Noncyclical), and Consumer Services (Discretionary/Cyclical), in that order. But if you prefer a defensive stance on the market, the model suggests holding Utilities, Consumer Goods (Staples/Noncyclical), and Healthcare, in that order.
Disclosure: Author has no positions in stocks or ETFs mentioned.
Disclaimer: This newsletter is published solely for informational purposes and is not to be construed as advice ...
more

