
Quick Take: Data, Drama And The Lines In The Sand
It’s “quick take” Friday (meaning you won’t have to plow through 1,000 words to get to the keys to the session) and my take is that two economic reports, the ongoing FBI drama (which may or may not turn into something meaningful for traders – so far, it appears not), and the near-term lines in the sand may be the drivers to the market action in the near-term.
On the economic front, we got reports on the state of the consumer via the Retail Sales numbers and the state of inflation from the monthly CPI stats.
Retail Sales for April rose by 0.4%, which was a tenth light compared to consensus expectations. However, the March numbers were revised higher, sales have increased in three of the first four months of the year, and retail sales totals are up 4.5% over the year-ago numbers. As such, one can argue that the consumer is feeling pretty good about things.
On the topic of inflation, after a decline of -0.3% in March, the CPI rebounded to a gain 0.2% in April – in line with economist estimates. On a year-over-year basis, the headline CPI is up 2.2%, which is down from March’s reading of 2.4% and February’s 2.7% (which had been the highest print since February 2012). Note, that although the Fed prefers to look at PCE as their preferred measure of inflation, the annual CPI reading is above the Fed’s target of 2.0% and supports Yellen’s current rate increase plans.
When you strip out food and energy (’cause nobody uses those items, right?) the Core CPI increased 0.1%, which was below the estimates for an increase of 0.2%. Year-over-year, the core rate is up 1.9%.
The takeaway this morning is that consumer spending remains healthy and that inflation has reached the Fed’s target zone. As such, today’s data continues to argue in favor of a June rate hike.
Looking at the stock market, the near-term lines in the sand are now quite obvious on the charts.
S&P 500 – Daily
(Click on image to enlarge)
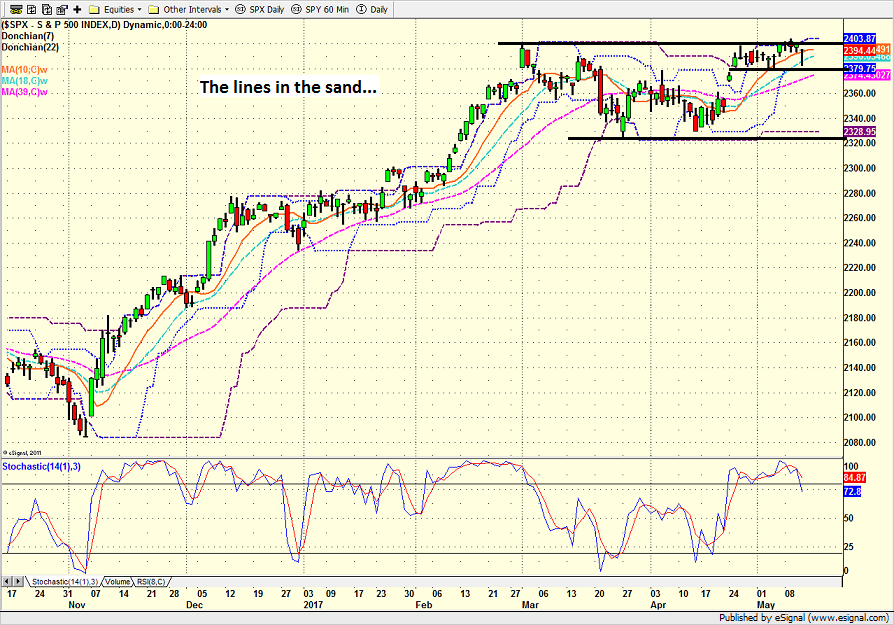
The bottom line is the bulls really need to “break on through to the other side” (hat tip to Mr. Emery for the tune rec) of the current trading range sooner rather than later if they expect to begin a new upleg any time soon.
The bears are targeting the 2380 area from a short-term perspective. And since this line is obvious to technicians everywhere, you can bet the algos will hit the sell button early and often should it be breached.
From an intermediate-term perspective, it looks like the S&P needs to remain above 2320 in order for the chart to remain “constructive.” From my seat, a break below this line would embolden the bears and initiate some “price discovery” to the downside, where Fibonacci retracement levels relating to the Trump Rally would likely come into play.
But for now, it’s “game on” and we’ll be watching to see which team can emerge victorious from the current tussle.
Thought For The Day:
The secret of success is to be ready when your opportunity comes. – Benjamin Disraeli
Current Market Drivers
We strive to identify the driving forces behind the market action on a daily basis. The thinking is that if we can both identify and understand why stocks are doing what they are doing on a short-term basis; we are not likely to be surprised/blind-sided by a big move. Listed below are what we believe to be the driving forces of the current market (Listed in order of importance).
1. The State of Trump Administration Policies
2. The State of the U.S. Economy
3. The State of Earning Season
4. The State of World Politics
Disclosure: At the time of publication, Mr. Moenning and/or Sowell Management Services held long positions in the following securities mentioned: none. Note that positions may change at any ...
more

