
Q3:2014 US GDP Nowcast: +2.2%
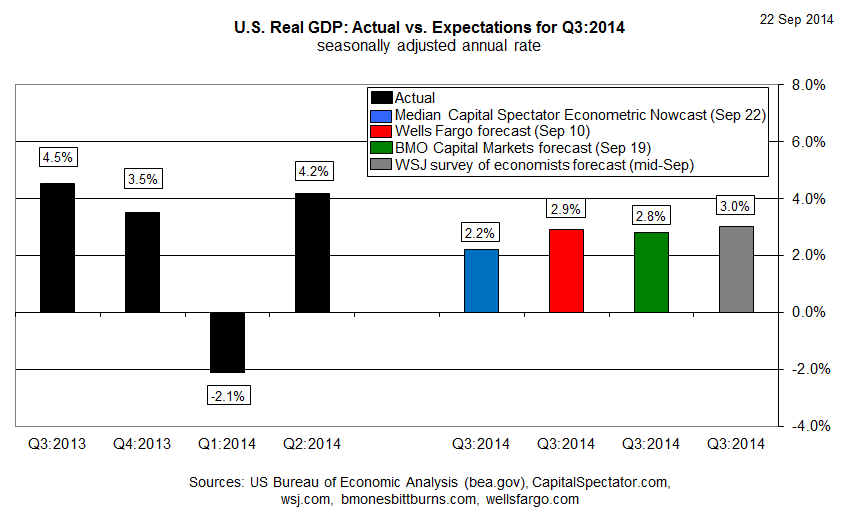
US economic growth will decelerate in the third quarter, according to The Capital Spectator’s median econometric nowcast. Today’s revised GDP estimate anticipates an increase of 2.2% (real seasonally adjusted rate) for the July-through-September period—down sharply from the 4.2% pace in the previous quarter, according to the Q2 report published by the Bureau of Economic Analysis (BEA) in late-August.
Today’s nowcast for the third quarter is slightly lower than last month’s preliminary 2.5% estimate and below several Q3 forecasts from other sources. The Wall Street Journal’s survey of economists this month, for example, projects a 3.0% gain for the official third-quarter GDP report, which BEA will publish on October 30 in its “advance” estimate.
The one thing that unites most predictions from economists for third-quarter growth at the moment is the assumption that next month’s Q3 numbers from the government will reflect a substantial round of downshifting vs. the previous quarter. Managing expectations down is also the message from corporate America’s chief executive officers CEOS, according to a survey published last week by the Business Roundtable. “While some US economic indicators are improving moderately, the results from our survey of CEOs seem to reflect an underperforming US economy held back by policy uncertainty and growing conflicts around the world,” says Randall Stephenson, chairman of Business Roundtable and CEO of AT&T.
Meantime, the chasm between Q2 and Q3 is set to widen further when the BEA releases its third estimate of GDP for the April-through-June period later this week. BEA’s revised numbers for Q2—scheduled for release on September 26—are expected to reveal even stronger growth for the previous quarter–4.6% vs. the current 4.2% estimate, according to the consensus forecast via Briefing.com.
As for the third quarter’s outlook, here’s a graphical review of how The Capital Spectator’s updated Q3 nowcast compares with recent history and forecasts from other sources:
Next, let’s review the individual nowcasts that are used to calculate The Capital Spectator’s median estimate:

As updated nowcasts are published, the chart below tracks the changes for context in assessing how the projections are evolving.

Finally, here’s a brief profile for each of The Capital Spectator’s GDP nowcast methodologies:
R-4: This estimate is based on a multiple regression in R of historical GDP data vs. quarterly changes for four key economic indicators: real personal consumption expenditures (or real retail sales for the current month until the PCE report is published), real personal income less government transfers, industrial production, and private non-farm payrolls. The model estimates the statistical relationships from the early 1970s to the present. The estimates are revised as new data is published.
R-10: This model also uses a multiple regression framework based on numbers dating to the early 1970s and updates the estimates as new data arrives. The methodology is identical to the 4-factor model above, except that R-10 uses additional factors—10 in all—to nowcast GDP. In addition to the data quartet in the 4-factor model, the 10-factor nowcast also incorporates the following six series: ISM Manufacturing PMI Composite Index, housing starts, initial jobless claims, the stock market (Wilshire 5000), crude oil prices (spot price for West Texas Intermediate), and the Treasury yield curve spread (10-year Note less 3-month T-bill).
ARIMA GDP: The econometric engine for this nowcast is known as an autoregressive integrated moving average. This ARIMA model uses GDP’s history, dating from the early 1970s to the present, for anticipating the target quarter’s change. As the historical GDP data is revised, so too is the nowcast, which is calculated in R via the “forecast” package, which optimizes the parameters based on the data set’s historical record.
ARIMA R-4: This model combines ARIMA estimates with regression analysis to project GDP data. The ARIMA R-4 model analyzes four historical data sets: real personal consumption expenditures, real personal income less government transfers, industrial production, and private non-farm payrolls. This model uses the historical relationships between those indicators and GDP for projections by filling in the missing data points in the current quarter with ARIMA estimates. As the indicators are updated, actual data replaces the ARIMA estimates and the nowcast is recalculated.
VAR 4: This vector autoregression model uses four data series in search of interdependent relationships for estimating GDP. The historical data sets in the R-4 and ARIMA R-4 models noted above are also used in VAR-4, albeit with a different econometric engine. As new data is published, so too is the VAR-4 nowcast. The data sets range from the early 1970s to the present, using the “vars”package in R to crunch the numbers.
ARIMA R-NIPA: The model uses an autoregressive integrated moving average to estimate future values of GDP based on the datasets of four primary categories of the national income and product accounts (NIPA): personal consumption expenditures, gross private domestic investment, net exports of goods and services, and government consumption expenditures and gross investment. The model uses historical data from the early 1970s to the present for anticipating the target quarter’s change. As the historical numbers are revised, so too is the estimate, which is calculated in R via the “forecast” package, which optimizes the parameters based on the data set’s historical record.
Disclosure: None.


