
Q3-Market Performance Review
Yesterday was the first day of the Fourth Quarter of 2018, so it’s a good time to assess where markets are for the year. Nobody should change their portfolios radically based on recent market moves, and, to the extent that anybody does, the bias should be selling what has dropped and buying what has surged. But, from time to time, it can be useful to observe recent trends.
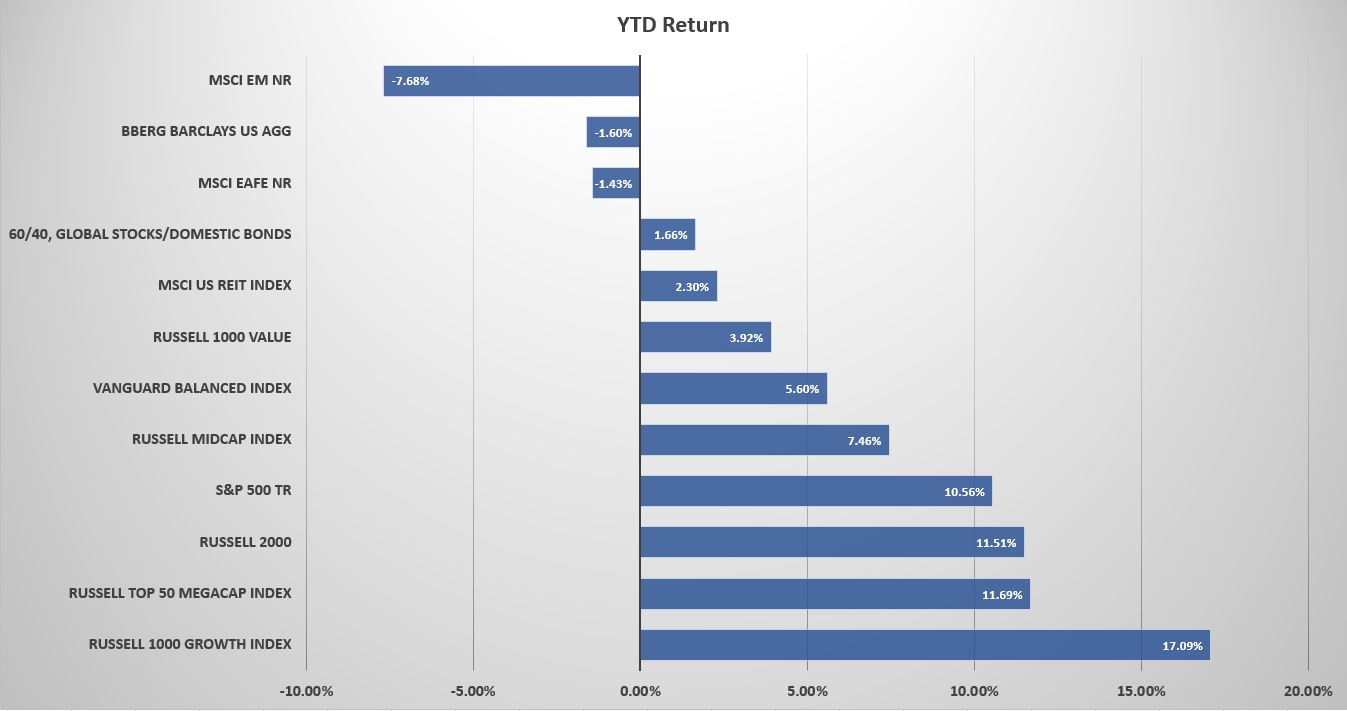
The first thing to notice about market returns through the first three quarters of 2018 is that U.S. stocks are up again. The S&P 500 Index closed the Third Quarter up 10.58% for the year, including dividends. Mid-cap stocks were up too, though less dramatically. The Russell Midcap Index gained 7.45% for the year through the Third Quarter. Small-cap stocks have gained about as much as the S&P 500, with the Russell 2000 Index up 11.51% for the year. And the Russell Megacap 50 Index also has a similar gain for the year of 11.69%.
Two Discrepancies
If U.S. stocks are having a good year, international stocks aren’t. The MSCI EAFE Index, which tracks stocks from developed countries, lost 1.43% for the year through the end of the Third Quarter. The MSCI Emerging Markets Index (MSCI EM NR) has done ever worse, shedding 7.68% for the year through the end of the quarter. Much of those losses are attributable to the dollar’s surge against foreign currencies, especially those of emerging markets. When U.S investors buy foreign stocks or a foreign stock fund, they typically get two sources of return, the stock’s return in its own market and the foreign currency’s return versus the U.S. dollar. That second return has hurt U.S. investors in foreign stocks this year, as the dollar has surged. A dollar surge also puts emerging markets under a cloud because emerging markets countries and companies borrow in U.S. dollars, making a dollar surge especially burdensome for them.
A second discrepancy is the difference in value and growth stocks. Value stocks tend to trade with lower price-earnings and price/book ratios, while growth stocks tend to trade with higher ratios precisely because of their anticipated growth in earnings and/or book value. The Russell 1000 Value Index rose a tepid 3.92% for the year, while the Russell 1000 Growth Index surged by 17.09%. the top-5 holding of the Russell 1000 Growth Index are Apple (AAPL), Microsoft (MSFT), Amazon (AMZN), Facebook (FB), and Alphabet (GOOG). The only one of the so-called “FAANG”s that it’s missing is Netflix, and the FAANG stocks have gained more than the overall market.
Bonds and REITs
Bonds, represented by the Bloomberg Barclays U.S. Aggregate Index dropped 1.6% for the year through the end of the Third Quarter. Interest rates have been rising in fits and starts. The yield on the 10-year U.S. Treasury has spiked up above 3% (where it rests now) during the year, but also fallen back at times. Bond yields move in the opposite directions of prices.
Volatility in the bond market has also likely influenced REIT returns. REITs pay out 90% of their net income as dividends in exchange for having tax-free status at the corporate level. The high dividend yield, low-growth companies often trade with some correlation to bonds. REITs (MSCI US REIT Index) tumbled in January and February of this year, the soared in March, May, and June. But in September they shed more than 2% to give them a roughly 2% year-to-date gain. That’s not terrible, but it lags the broader market’s return considerably. Large REIT companies that have declined for the year include paper and forest products company, Weyerhaeuser (WY), office landlord Boston Properties (BXP), and medical space REIT Ventas (VTR).
Judging Your Portfolio
If you have a lot of REIT exposure, that has probably been a drag on your portfolio. That’s why gunning after the highest yielding stocks is sometimes not a good idea. Additionally, if you have a lot of international stock exposure, that’s also been a drag. The discrepancy, for example between the year-to-date returns of the Vanguard Balanced Index Fund (5.6%) and an index consisting of 60% MSCI ACWI (All Country World Index) and 40% U.S. bonds (1.7%) is large.
That doesn’t mean you should exit all your international stock positions. What does badly one year can do better the next. In 2017, for example, international stocks outpaced domestic stocks, and emerging markets stocks, the dogs of this year, gained 37% versus the 22% gain of the S&P 500. Picking a single year’s winners isn’t easy.
Overall, investors should know that domestic stocks are considerably overpriced by any valuation metric one chooses to use. That doesn’t mean they can’t get more expensive, but nobody should be anticipating robust long-term returns from U.S. stocks.


