
Probabilities For Profit - A Performance Forward Look At Three Of My Twelve U. S. Sectors
The third set of three of my Sectors of twelve are and three of my 37 Similar Groupings:
Health Care
Industrials
Retail
Note: There are over 30 distinct Industry Groups within just these three sectors which must also be monitored and forecast on a weekly basis. You have to work to profit in this Market! The old days are gone forever . . .
My logo for over 50 Years is: "Investing Wisely."
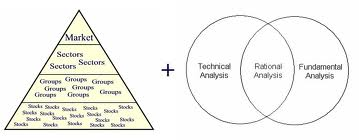
The below graphic is simple and what you must understand if you want to consistently be a profitable Investor.
My below four tables - quantifies the "ODDS" of making money and being consistently profitable within my select U.S. General Market - -Sectors - - MY Groupings. Remember - sectors are a rather broad breakdown and perspective of the general stock market and its indices - they must also be narrowed to the industry groups. Narrowing the "broad breakdown" is mandatory these days and it is important to be reminded that each sector has a number of Industry Groups that also must dissected weekly.
At this writing, these three sectors (previous weekly data) contribute to the suggestion that the bull market is deteriorating. At this stage, it is always a slow process of topping a multi-year bull market. It therefore requires much patience and discipline. Do your homework daily.
Probabilities Can Be Easily Calculated from Data and Create "Odds"
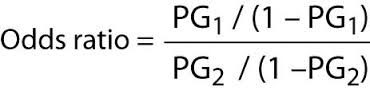
Yes, the "Odds" of being Profitable Can Be Calculated Ahead of Buying or Shorting.
Probabilities are just my way of using public information and data readily available on the Internet (mostly data) to compile and compute the forward / bullish / bearish or sideways also-rans direction of the stock market, sectors, industry groups, commodities, companies and ETFs. This part of my methodology of "Investing Wisely" is what I call "dissecting the market." It presents very accurate and valuable weekly Statistics and (a set of) odds of the probability of profiting in the current Bullish or Bearish general stock market environment.
Fundamental Valuation is a very mechanical / mathematical process but over the more recent years it has become an art as well as a science. Each Client recommended security goes through a fundamental valuation and is compared with many peer companies to be sure that my "cherries" are ripe and succulent.
Risk can be managed and actually quantified (calculated) quite easily when you have the tools and experience. I have those tools and many years of experience of using them wisely to profit. Computing the "threshold of risk" is also essential if you want a profit to loss ratio of 90+% or better.
Technical Analysis for me is very different than what you are being lead to believe. It is not an accurate measures of securities. Formulas and systems don't work either. I believe that this was proven conclusively in my required doctoral studies. For me it means use -cycle analytics and this is a very accurate approach identifying bullish and bearish primary and secondary inflection points for the general market, sectors, industry groups, commodities, companies and ETFs.
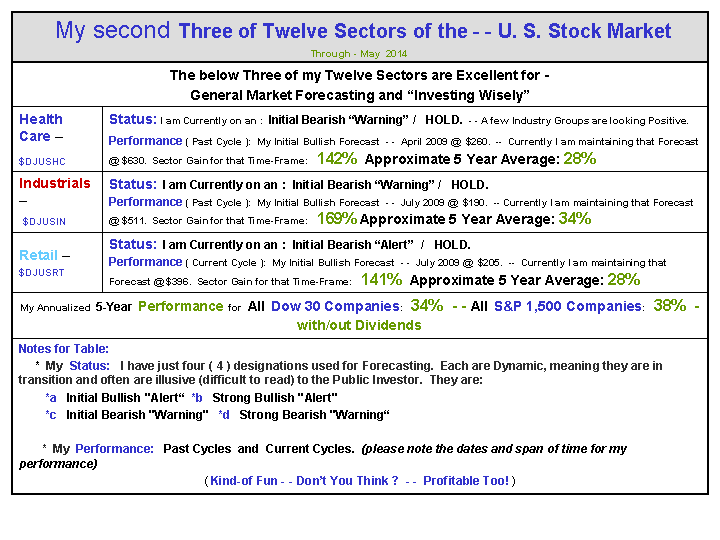
Table I of Past 5-Year Performance and Forecasted Performance for the Coming Year

You can stop here and just try to take advantage of this table. Unfortunately, these percent figures are dynamic! That means they are changing, sometimes improving and other times declining.
Table II of Current Status and Performance for: Energy - Oil & Gas / Gold & Silver / Financial
Every sector and industry group has taken some big hits over the years. Check the following longer-term charts out!
Long-Term Charts for these three Sectors
Just Click to View my Long-Term Chart for each Sector:
The "Odds"
I present the "odds" of your profiting in the stock market in a very unique way. As the stock market endlessly cycles from bullish to bearish and then back to bullish again all securities cycle, within their own realm, rotate (in an endless loop) from "favorable" to "unfavorable" to "also-rans." It is this endless loop that is easily calculated and quantified.
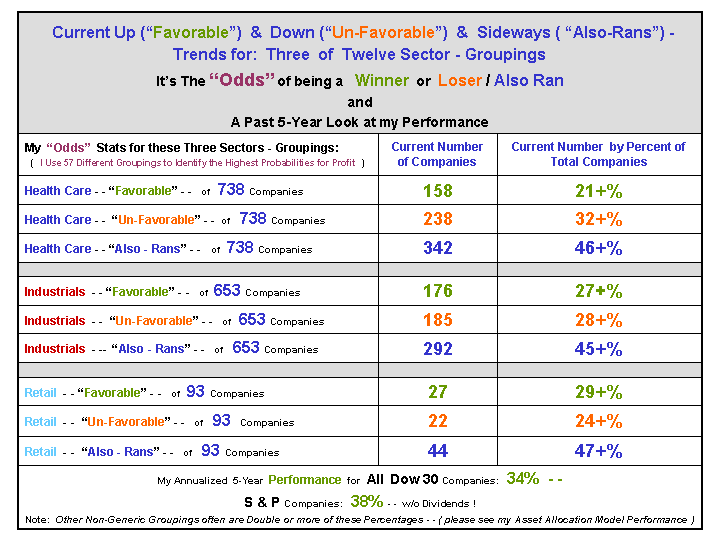
Table III - It's YOUR CHOICE - My Table of the Probabilities or Odds
The following Table should tell you a very compelling story, I hope so. Unfortunately, this table also takes time to understand. I hope YOU take that time and perhaps ask questions of me via Email.
Here are a few of suggestions to ponder:
"Investing Wisely" requires that I have a large matrix of probability data from which I can calculate the "odds" and hence the true risk / reward ratio for each and every company and ETF before investing.Saying it another way, this work also provides the remarkable ability to calculate the percent profit potential for each security I may be considering for recommendation.
Here are some suggestions to ponder. A 20% profit potential is minimum.
a) These three sectors are basically deteriorating when correlated with my previous data archive. Only when the favorable is above 50+% do I consider that sector or (grouping) having any prayer of producing reasonable profits in the foreseeable future. Conversely, this means that to take short positions in a bearish environment I want the unfavorable to be over 50+%;
b) When the above "loser" figures ("unfavorable and "also-rans") are clearly 50+% in control - percent wise you have little chance of profiting and that's unacceptable odds (please re-visit my above supporting tables);
c) Numbers, raw data, statistics and odds don't lie, it is always the author / blogger that so often does so - hopefully unknowingly or naively;
d) You will begin to benefit (profit consistently) if you will accept and perhaps question what I am sharing.
Caveat: I do not publish these figures frequently enough for you to use them to help make your investment decisions. Please Don't! As you know I preach "Selectivity" in many of my articles.
Table IV - Current Loser Ratio by Percent
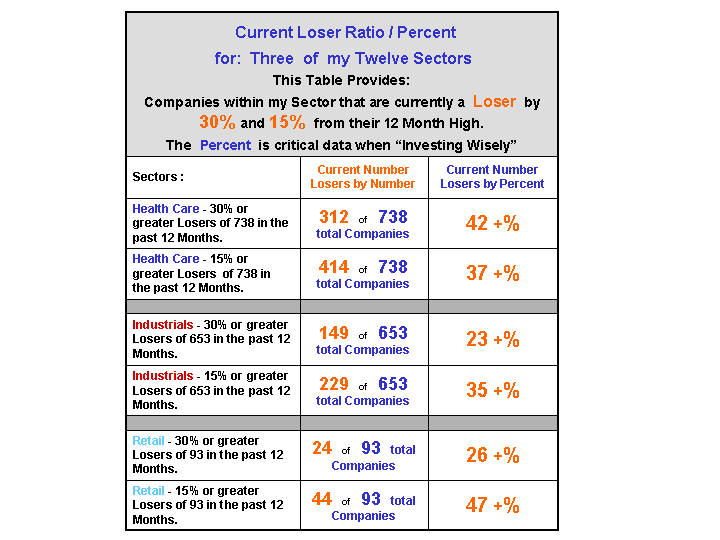
I also recommend focusing on the "losers." Greed is fine but profits come from knowing the difference between the winners and the losers. It is simple to do so:
a) Eliminate the Losers and you have the Winners;
b) Identify the winners by knowing and understanding both their fundamentals with their valuation and probability for profit;
c) Employ a proven technical / cycle analysis
d) Voila, you have a consistent methodology for profiting in the stock market.
Appealing to your greed (with a smile)
I believe what I have shared above is both a unique and profitable methodology of "Investing Wisely."
Summary
Of my 12 Sectors, currently two are currently losers, three more are on the edge of becoming losers and seven remain relatively strong and on a hold. For reference, just six months ago there was only one loser. Of the other 25 groupings the picture is much more bearish. My forecasts suggest that within the next six months, perhaps less, a notable number, though not all of my sectors, will become losers.
It is simple mathematics with a few caveats, when there are mostly bullish sector, industry groups and companies you have a bull market. It should be somewhat obvious that when, "vice-versa" occurs your have a bear market. The latter is in the making.
The trick is knowing the bulls from the bears! I do that task very well because I actually live with those critters. As this never ending process occurs, indices (INDU, Nasdaq, S&P, etc.) will be taking hits or pull-backs that will clearly confirm to you that a bear market is in the making. This has been occurring for many months now!
I sincerely hope you conclude that having an archive of all this (favorable/unfavorable/also-ran) data is an extremely valuable resource. One that provides direction and guidance to me as the analyst and for you to invest exclusively where the probabilities for future profits are.
Should you have interest in my professional guidance and direction for your Portfolios, please Email Me with your questions or thoughts: senorstevedrmx@yahoo.com.


