
Pound Sterling’s Prospects – Seeing Through The Brexit Fog
Historically, Britain has long been affected by literal mists and fogs which became much more severe after the onset of the Industrial Revolution in the late 1700s, as factories belched gases and huge numbers of particles into the atmosphere. To combat these, series of laws were brought in including the Clean Air Acts of 1956 and 1968. These acts banned emissions of black smoke and decreed residents of urban areas and operators of factories must convert to smokeless fuels.
If only it was that simple to deal with equally serious and far reaching financial fog which surfaces periodically. Britain’s exit from European Union Mechanism in 1992, the banking crises leading to run on banks and large scale bailing out by the government to name just 2 in recent times.
Now we are faced with a fog called “Brexit”. Many politicians, experts and commentators are marshalling their well rehearsed arguments for and against causing utter confusion for the common folks. It is hard to evaluate all the relevant factors, many of which might have been forwarded by individuals or institutions with self-interest. So it qualifies as finical fog through which we must navigate. As “Technical Analysts and Traders” we could pay more attention to what the price is telling us about how the matters will look once the fog is lifted.
To do that we will take a look at series of price charts of GBPUSD over several decades and over the last few years observing what it reveals to arrive at possible conclusion that could enable us to plan our trade to benefit from this mess.
Chart 1 – Monthly charts from 1952.
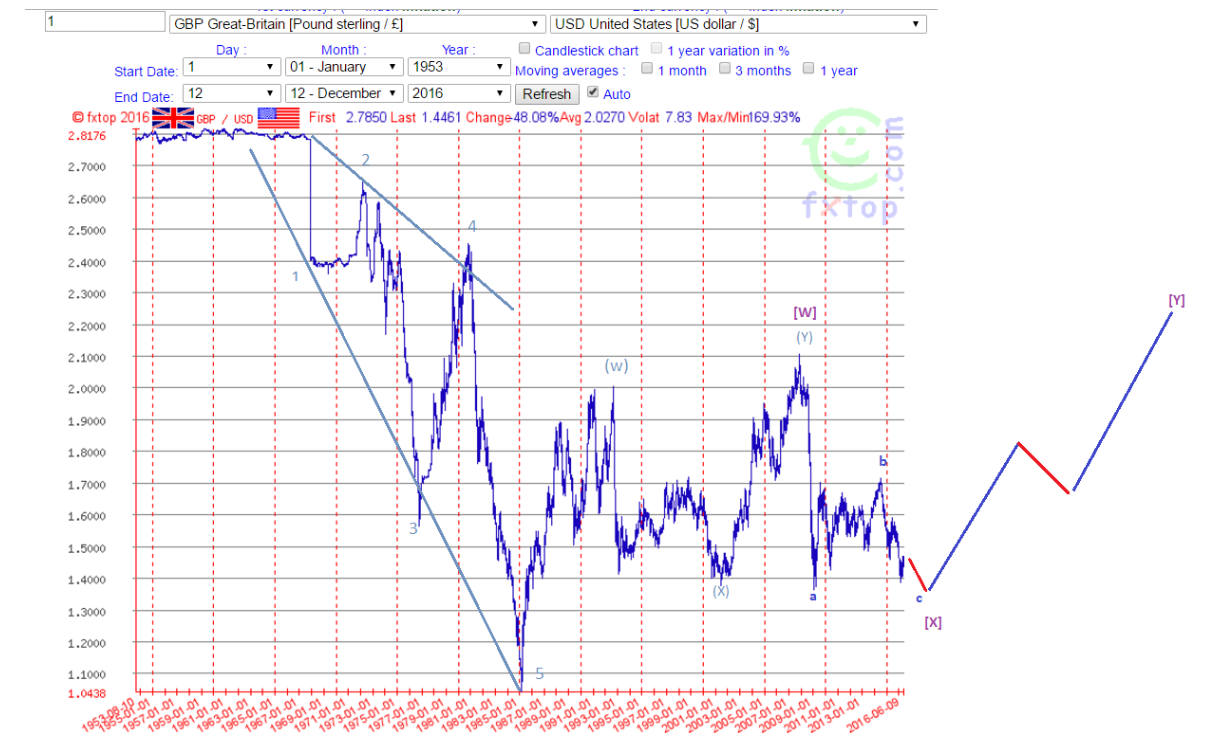
The chart above is a monthly chart of price history dating back to 1952 from where it appears to have declined in 5 waves (numbered 1 -5) and which resembles declining megaphone called “Expanding Ending Diagonal” (EED) in Elliottewave terminology. I say ending as supposed to leading since powerful British Empire has been in long term decline and if it’s currency reflects that, then it could well be EED and the assumption will suffice for our analysis of the GBPUSD for the period that interest us.
This cycle appears to have ended with low which formed in March 1985, taking in excess of 30 years but it only forms last wave of larger 5 waves or an ABC zigzag suggesting the entire bigger cycle could have lasted for significantly longer period.
Chart 2 -Monthly chart from 1984
(Click on image to enlarge)
(Click on image to enlarge)
In the chart above we note that from 1985 low we could be progressing in a retracement or correction cycle, which too could last for several decades having completed only a part of that cycle labelled [W] at September 2007 high, which itself is a complex zigzag consisting of (w), (x) and (y) as shown in the chart.
From 2007 high [W], the price is declining in another intermediate zigzag labelled a,b,c with asharp decline in Wave a to December 2008 low, and bouncing in Wave b, a complex minor zigzag (w,x and y) resulting in July 2014 high. From this high we are declining in Wave c, which consist of 5 minor waves and is taking the shape of falling wedge called “Ending diagonal” (ED).
If this observation is correct then we could have just completed retracement wave iv and now are in early stage of resuming the decline in wave v being the final part of this cycle, which could complete with a low being formed in the region of 1.35 – 1.33 towards the late 2016 and might spill over in 2017.
The late 2016 and early 2017 as possible time window for completion of this cycle is estimated by Fibonacci extension of time taken for wave [W] from 1982 low to 2007 high, where 141.4% of that period lands us at March 2017. Similarly on the chart above I have highlighted 2 orange boxes where the first one takes the period from March 1993 low to September 1998 measures 67 monthly bars and the second is from December 2009 low to July 2014 high measuring 66 monthly bars (difference of just 1 bar) appears to be demonstrating a time symmetry between them of similar cycle namely a retracement bounces of low.
If similar time symmetry plays out for subsequent drops from these respective bounces shown in magenta boxes, then the period from September 1998 high to June 2001 low measures 32 monthly bars. If this is repeated for the current drop from July 2014 high it would land us around February/ March 2017, a period when seasonally major lows are formed in this currency pair (GBPUSD) see chart below from EquityClock.com.
Chart 3 – Seasonal Chart
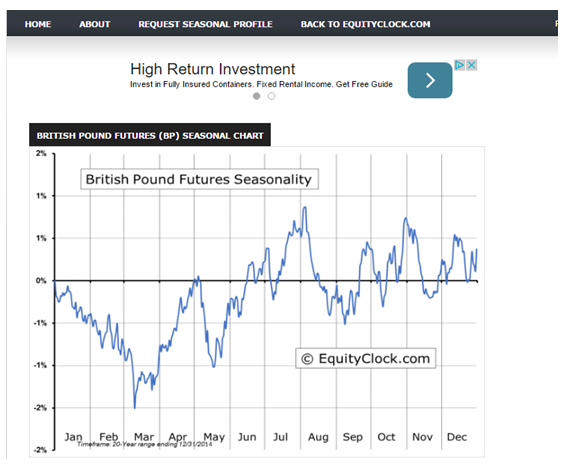
In addition there are other time symmetry and Fibonacci price retracement and projections (features marked on the chart below and earlier charts) which suggest that late GBPUSD could continue to be weak leading to late 2016 and early 2017 for time window and 1.35 – 1.33 for the price zone for a significant low to form.
Chart 4 – GBPUSD Weekly chart
(Click on image to enlarge)
Upon this low being formed as explained above a significant trend change is likely that could last for several years we embark on another large zigzag wave [Y].
Conclusion:
1. Trade bias
- Is in the short and intermediate time frame selling GBPUSD could be profitable till completion of the cycle.
- Once we complete this cycle and form a low, longer term buying GBPUSD could be appropriate.
2. Exit Vote is real possibility:
The cycle in progress is currently trending down and is likely to continue as describes above regardless of the outcome of the Referendum Vote. However, if this sizable decline over several months is to continue, then it would fit the exit scenario more aptly as that would lead to initial knee jerk reaction with GBP being sold but once we complete the cycle it would be able to commence the bullish cycle. Much like the 1992 when it exited European Monetary Union Mechanism and GBP plummeted but ultimately formed a low and went on the bounce for several years.
Can you see through the Brexit Fog with some clarity without reverting to all the pros and cons being debated in the media?
I trust the above will help you plan appropriately regardless of the outcome.
Disclosure: As always, please do your own due diligence and analysis for your requirement.


Reposted the main chart on Tradingview for ease of tracking future price action, Chart Link - www.tradingview.com/.../C2He0lRg-POUND-STERLING-S-PROSPECTS-SEEING-THROUGH-THE-BREXIT-FOG/
Thanks for the link.
very interesting article. Thanks.
Insightful analysis, thanks.
very good Analysis.. thank you
You are welcome.
Good read, thanks.
Thank you for your appreciation.
Looks like the work of Anil mangal to me
Thank you for your comment. I can assure you there is no connection of any kind to him or his appraoch.
I've known the author, Dan V., for two years and he is a very good analyst. There are many ideas in his analysis tradingview website. Thank you again Dan V!