
Portfolio Analysis In R: Risk-Contribution Analysis
Do you know where the risk in your portfolio is coming from? Well, of course, you do. After all, you designed the portfolio and so the asset weights reflect the risk contribution. A 50% weighting in stocks translates into a 50% contribution to risk for the portfolio overall, right? That’s a reasonable first approximation, but it’s a crude estimate and one that’s prone to error as market conditions change—particularly for a strategy that holds a mix of asset classes. For a precise profile of the relative contributions from each piece of the portfolio—an essential piece of intelligence for risk management—we’ll have to go deeper into the analytical toolkit.
The reasoning for decomposing portfolio risk into its constituent parts is straightforward: the relationship of risk across assets is in constant flux through time. As a result, correlation and volatility are changing. The main takeaway: your portfolio’s risk profile may differ from your assumptions—perhaps radically so at time. The only way to know if your estimates match reality is to routinely run the numbers and make periodic adjustments to the asset allocation when appropriate.
An exaggerated example tells us why this facet or risk management is essential. Let’s say that you’ve designed a portfolio with an 10% allocation to emerging market stocks on the assumption that 10% of total portfolio risk will be driven by these assets. Because of shifting relationships with other assets, however, it turns out that the risk contribution from emerging markets rises to twice your assumption after three months—20%. The problem is that this change might not be obvious without formally modeling the risk-contribution factor.
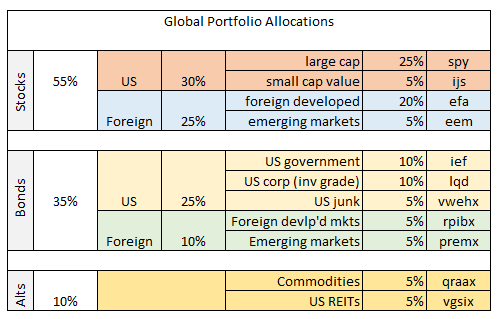
Let’s dig into some details with a real-world example. As in previous installments in this series (see list of articles below) we’ll use our standard sample portfolio (unrebalanced in this case), which consists of 11 funds for testing a global mix of assets, spanning US and foreign stocks, bonds, REITs and commodities, based on the following target allocations:
Calculating risk contribution requires building a covariance matrix and running matrix algebra calculations, but don’t worry–we can streamline the task with user-friendly functions in the PortfolioAnalytics package via calculations in R (here’s thecode for generating the raw data that’s discussed below).
For simplicity we’ll use the conventional definition of risk—standard deviation, aka return volatility. In practice we can apply other risk measures, such as value at risk, extreme tail loss, and other quantitative metrics. But in the example below we’ll stick to standard deviation to illustrate the basic outline.
As a preliminary step, here’s the risk contribution for the sample portfolio (defined above). Note that this is based on the daily data from 2004 through yesterday (Jan. 11). It’s no surprise to find that the contributions generally align with the target allocations. For instance, the 30% weight for the US stocks (SPY) compares with a risk contribution of roughly 33%, as shown in the chart below. But there are some deviations as well.

Consider how real estate investment trusts (REITs) compare in terms of the target allocation vs. the risk contribution. We initially allocated 5% to REITs (VGSIX), but it turns out that the risk contribution is twice as high at nearly 10%.
Note too that the risk contribution is slightly negative for the allocation to Treasuries (IEF). The negative number indicates the relatively strong degree of volatility reduction that this asset brings to the mix. As a result, the negative risk contribution means that increasing (lowering) the weight to IEF will lower (raise) the portfolio’s volatility. In other words, IEF’s unique role as a diversification agent is quite clear when we run the numbers for this portfolio.
The problem with looking at risk contribution across long periods of time as a single data set is that the analysis suggests that this facet of the portfolio is static. In fact, risk contribution is constantly changing. The evolution is usually gradual, but it’s valuable to keep an eye on the changes through time in order to minimize the surprise factor vis-à-vis sudden shifts in the portfolio’s risk profile that may conflict with the investment goals, risk tolerance, etc.
For a more realistic (dynamic) measure of risk contribution we can monitor the ebb and flow based on rolling historical windows. For example, here’ how the risk contributions for the funds compare on a rolling one-year basis, as shown in the next chart below.

Based on this history, we can see that the risk contributions are relatively well behaved through time. The allocation to US equities, for instance, has generated risk contributions ranging from the high-20% level up to around 40%. We may or may not find these results satisfactory, depending on the portfolio’s goals and our risk expectations. The key point here, however, is that we now have hard data on the historical relationship between the relative share of risk for each asset.
What can we do with this information? There are several applications that may be productive. Let’s consider just one by focusing on the US equity holding (SPY) in terms of its rolling 1-year return vs. its risk contribution (see chart below). As you see, there’s a moderately negative correlation between the two metrics. The relationship implies that there may be useful signals here that tell us that an asset allocation adjustment is timely—particularly when the risk contribution and trailing return move to relatively extreme levels simultaneously.

Monitoring risk contribution doesn’t replace other risk-management tools—instead, it’s a compliment that enhances our overall risk-management process. Its part of what’s known as the risk budgeting process. Although conventional asset allocation focuses on the relative share of each holding’s capital contribution, there’s a strong case for monitoring portfolios through a risk lens as well. In fact, it’s reasonable to consider the possibilities via a risk-allocation process vs. a traditional capital-allocation framework.
Ultimately it’s the risk exposures that matter for engineering return outcomes. That’s an intuitive point, of course, and one that’s been widely embraced. Using a risk-attribution toolkit allows us to refine the concept in order to maximize the associated benefits and minimize any unexpected results that can arise when relying on vague rules of thumb for managing risk.
Disclosure: None.


