
Par For The Course
The action remained “sloppy” on Thursday as once again, the early gains were met with selling. And if one looks closely at the charts, yesterday marked the sixteenth consecutive session where at least some sort of significant intraday selling took place. In other words, you have to go back to September 22nd in order to find a session where the day’s gains were held into the close.
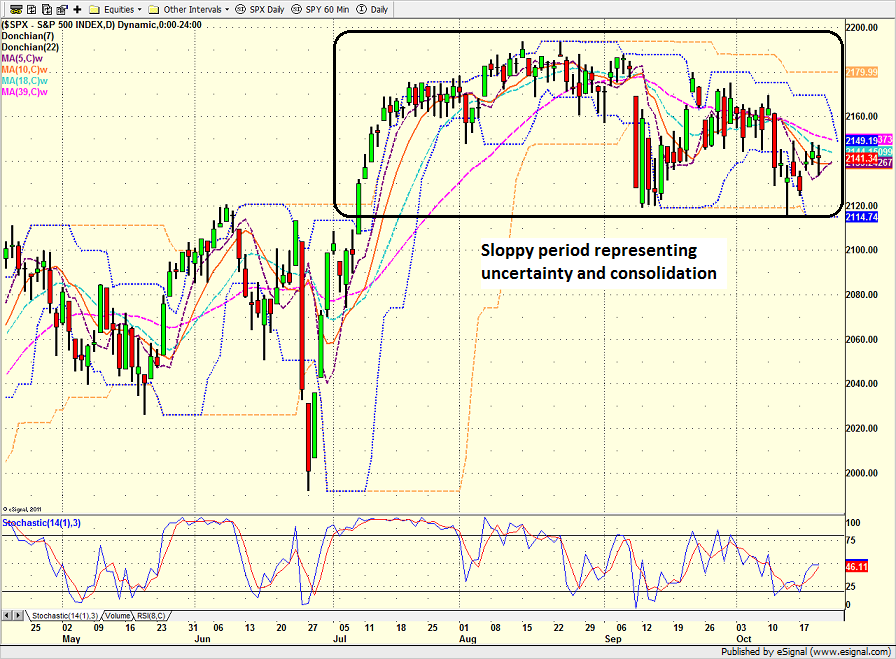
As the chart below clearly shows, stocks have been moving largely sideways since mid-July. Some suggest that this three-month period of sloppy action is representative of all the uncertainty in the market over issues such as rates, the dollar, the global economy, the election and/or the Fed. Others contend that the sideways action represents a period of consolidation following the big run from the February low and that the bulls are just resting. However, the bottom line is it has been a frustrating time in the stock market.
S&P 500 – Daily
(Click on image to enlarge)
Before you throw up your hands and give up on the market however, it is important to keep in mind that the current sloppy period is actually par for the course at this time of year. As I’ve detailed many times prior, stocks typically trend lower during the mid-August through early-November period. And if memory serves, buying the October/November low each year has usually been a very profitable endeavor. (Of course, knowing where the actual low for this period is tends to require a healthy dose of hindsight!)
So, point number one on this fine Friday morning is that anyone looking to capitalize on this seasonal trend or to “buy the dip” needs to wake up and realize that it is time to take action. Can stocks go lower? Sure. Is there any guarantee that the current fears will kill the year-end rally? Absolutely not. Can the current big bucket of worries continue to keep the market bottled up? Of course. But if investors like to play the historical patterns and the corresponding odds of success, it’s now time to start getting your buy orders ready.
The second point I’d like to make here is that although the action has been frustrating to both teams for what feels like forever and a day, this year’s seasonal sloppy period has actually been better than expected.
Take a peek at the chart below. The blue line represents NDR’s Cycle Composite (which combines the one-year seasonal, the four-year Presidential, and the ten-year decennial cycles into a single composite) and the red dashed line is the actual movement of the S&P 500.
(Click on image to enlarge)

When I look at this chart (which I do on a daily basis), the first thing I see is that the market diverged badly from the composite’s projection in January. In short, the market went down hard when it usually goes up. Next, stocks rallied furiously during the mid-February through mid-March, when the cycle projection called for a sideways stall (thank-you Mr. Draghi and Mr. Abe). Then from mid-March until now, stocks have largely followed the script and performed in line with what the cycle composite projected. Well, except for the BREXIT freakout and recovery, of course.
Now please focus your attention on the rectangle I’ve added to the chart, which is the traditional “fall swoon.” Note that the cycle composite actually called for a deeper decline than we’ve actually experienced as the red dashed line is still well above the blue line.
Next, if you look really close, you can see that the seasonal sloppy period is slated to end in just a few days. And that from there, the market has tended to embark on what is commonly referred to as the “year-end rally.”
So, if the historical pattern is going to play out, we should see stocks run back to the highs in the near future. This would be followed by a pullback and then a nice recovery to new highs into New Year’s eve.
The question, of course is if the seasonal pattern will play out. And to be sure, the “year-end rally” can be tricky to catch as there are usually plenty of reasons to fear that Santa may not make an appearance at the corner of Broad and Wall each year. However, if one takes a longer-term view and recognizes that the majority of the market’s gains tend to occur during the November through April period, now is the time to think about putting capital to work.
Current Market Drivers
We strive to identify the driving forces behind the market action on a daily basis. The thinking is that if we can both identify and understand why stocks are doing what they are doing on a short-term basis; we are not likely to be surprised/blind-sided by a big move. Listed below are what we believe to be the driving forces of the current market (Listed in order of importance).
1. The State of the Earnings Season
2. The State of Global Economies
3. The State of Global Central Bank Policies
4. The State of U.S. Dollar
5. The State of German/European Banks
Thought For The Day:
People too weak to follow their own dreams will always find a way to discourage yours –Unknown


