
Order Ends And A New Era Begins For The S&P 500
The relative period of order for the S&P 500 that began back on 31 March 2016 has come to an end.
The breakdown of order in the S&P 500 became clearly evident on 11 January 2017, when the level of the S&P 500 surged to be more than three standard deviations above the mean trend curve that has described the relationship between stock prices and their trailing year dividends per share since the end of the first quarter of 2016. Tracing this break in trend backwards to when it first took hold, we find that the last day that the previous period of relative order could be reasonably be said to have held is 29 December 2017, the last day of trading at the end of the fourth quarter of 2017, which is when stock prices were last within one standard deviation of the established mean trend curve.
(Click on image to enlarge)
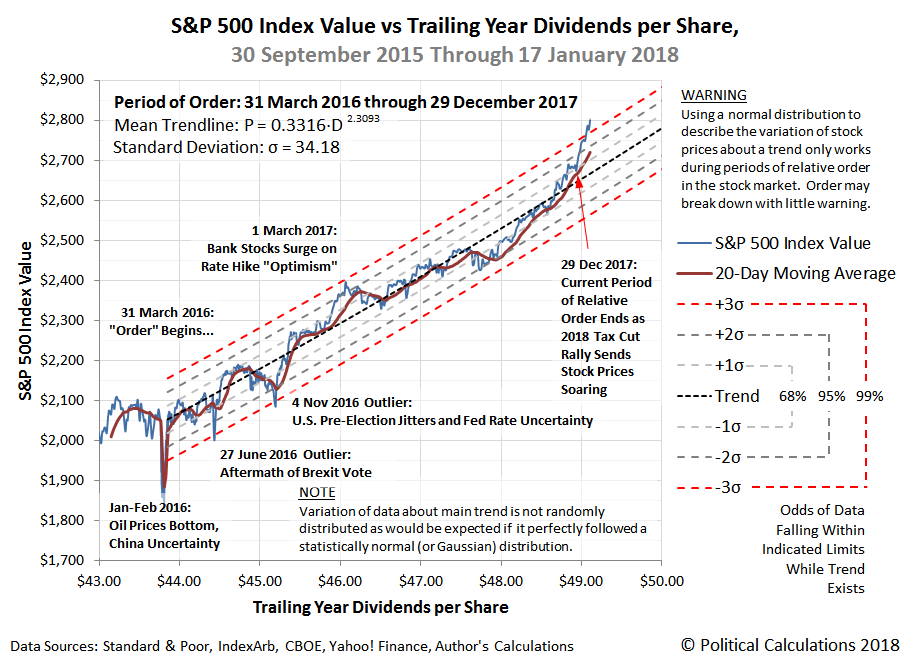
That makes the explanation for what caused the break in order relatively easy to determine. We believe that it may be fully attributed to the passage of the Tax Cuts and Jobs Act of 2017 on 22 December 2017, the provisions of which would take effect in 1 January 2018, to which investors would respond vigorously to their new incentives from the law beginning with the first day of trading in 2018 on 2 January 2018. It then took just eight trading days for the break in the previous period of relative order in the U.S. stock market to become definitive.
The new incentives for investors arise from the large and permanent reduction in corporate income tax rates, where investors may benefit by realizing larger dividend payments, by companies using their newly-freed funds to increase their productive investments, to lower their prices to consumers to gain market share, to better insulate themselves against having arbitrarily higher costs from government-mandated expenses imposed upon them (firms boosting the wages of their lowest paid employees can be said to be taking this action), or to simply use the opportunity of the newly-freed funds to improve their balance sheets. Or some combination of any or all of the above.
In a number of ways, the initial response of the stock market to the passage of the Tax Cuts and Jobs Act of 2017 is similar to what happened to stock prices following the passage of the Tax Relief Act of 1997, which caused the Dot Com stock market bubble to inflate. Unlike that event, where the differences in tax rates between dividends and capital gains changed the rate of return math for investors with dramatic and unstable effects upon stock prices, the changes that U.S. firms make in response to the Tax Cuts and Jobs Act of 2017 are much more likely to affect the fundamental expectations that investors have for their future business prospects, making a similar bubble unlikely.
No matter what, the U.S. stock market has entered into a very different period than it was before. How will that affect your investment decisions?
Disclaimer: Materials that are published by Political Calculations can provide visitors with free information and insights regarding the incentives created by the laws and policies described. ...
more

