
Online Retail Sales Effects On GDP Growth
In this article, we will look at the explosive growth of online retail and the latest results from the September retail sales report. As you can see from the chart below, non-store retailers, which are online stores, have grown to 11.41% of total retail sales.
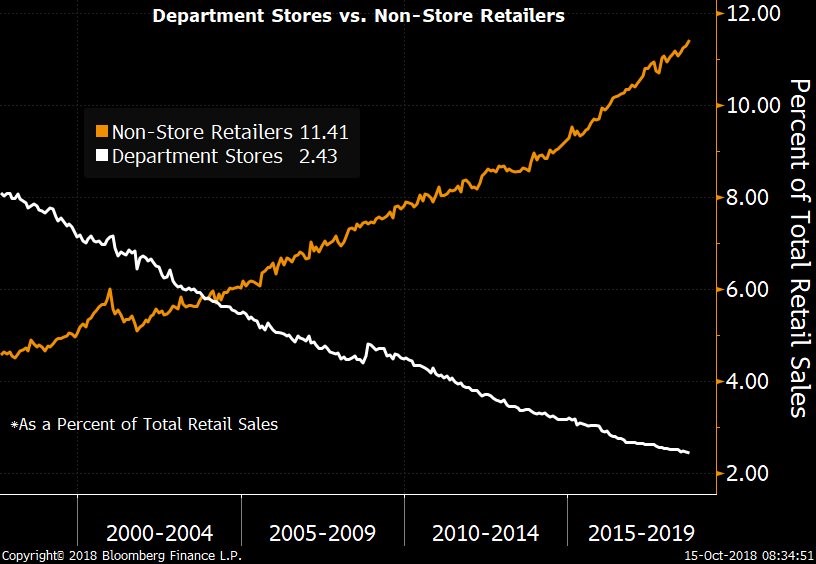
Source: Bloomberg
Many younger Americans are probably surprised at how low that percentage is because they shop for most things online. Retail stores have become showrooms where consumers try out products and then go online to find the best price.
The market share gains of online retail have come primarily at the expense of department stores. The most obvious example of this change is the bankruptcy of Sears, while Amazon reaches nearly a $1 trillion market cap. Amazon is now opening stores with highly rated products, bookstores, and owns Whole Foods. Even the biggest online sales firm sees the need for stores.
The definition of what a store is has changed. Physical stores are utilized for returns, picking up items bought online, asking questions about the product, and testing products in person. The most successful physical retailer in terms of sales per square foot is Apple. The stores are oriented towards consumers testing products in person and employees solving customers’ problems. Physical stores aren’t dead; they simply have morphed. A previous metric we reviewed, retails sales per capita tells the real story about physical stores.
Online Sales In Each Country
It’s interesting to look at online sales in each country to see which countries are the furthest along the growth trajectory. It’s also interesting to see where growth can go by reviewing the top countries. Countries need decent infrastructure, wealthy consumers, and proliferation of high-speed internet to have a high percentage of their retail sales online.
The chart below reviews 2018 estimates for online sales as a percentage of total gross revenue.
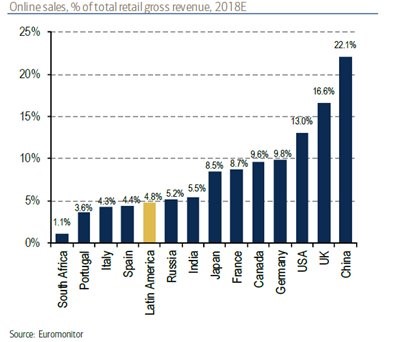
Source: Euromonitor
Most countries are below America as European nations such as Portugal, Italy, and Spain are in the low single digits. Even though India is a young growing country, poverty keeps it at 5.5%. The U.K. is at 16.6%. This explains why marketers often survey U.K. teens when measuring the latest internet trends, such a social media usage. China is the highest at 22.1%. It’s fair to wonder how high growth can get for certain categories like heavy materials, machinery and produce. Not all categories are created equal when it comes to online sales. The runway for America to get from 13% to 22.1% is there. Millennials gaining purchasing power will cause online sales to increase further.
Less Retail Workers Needed
The chart below shows the historical number of workers needed to generate $1 million in sales per year from different categories.
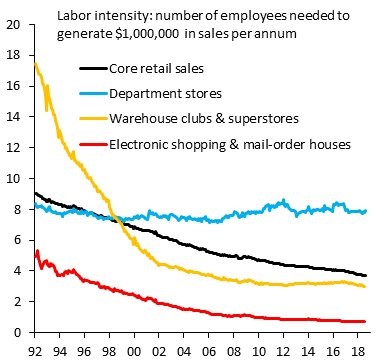
Source: Twitter @RobinBrooksIIF
It takes less than 1 worker to generate $1 million in sales for online stores. Warehouse clubs and superstores have seen an amazing amount of efficiency gains in the past 36 years as the metric went from above 17 workers to below 4. Core retail sales have improved from about 9 in 1992 to about 4 in 2018. Department stores went from being slightly more efficient than core sales in 1992 to needing double the workers to generate equal the sales as efficiency has been stagnant. This explains why department stores have gone from about 8% share in the late 1990s to just 2.43% share now.
The shift from the less efficient department stores to the more efficient online stores explains the weakness in retail employment despite strong sales growth this cycle. The chart below shows the 6-month moving average for retail employment is down even though the economy has been strong in 2018 as consumer sentiment is near a record high and retail sales growth has been great.
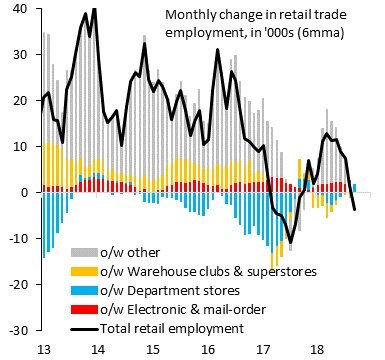
Source: Twitter RobinBrooksIIF
September Retail Sales
The retail sales report is important because it gives us an idea of where consumption growth will be in Q3. That’s a big input for GDP growth. Month over month September retail sales growth was 0.1% which was the same as August and much below the consensus for 0.6% growth. Year over year growth fell from 6.5% to 4.7%. Sales growth excluding autos was down 0.1% month over month and sales excluding autos and gas were flat. Both missed estimates for 0.4% growth.
Arguably the most important number was strong in this report as month over month sales growth in the control group was 0.5% which beat estimates for 0.3%. As you can see from the chart below, year over year control group sales growth improved slightly to 5%. That’s near the cycle peak of 5.9% in July 2011.
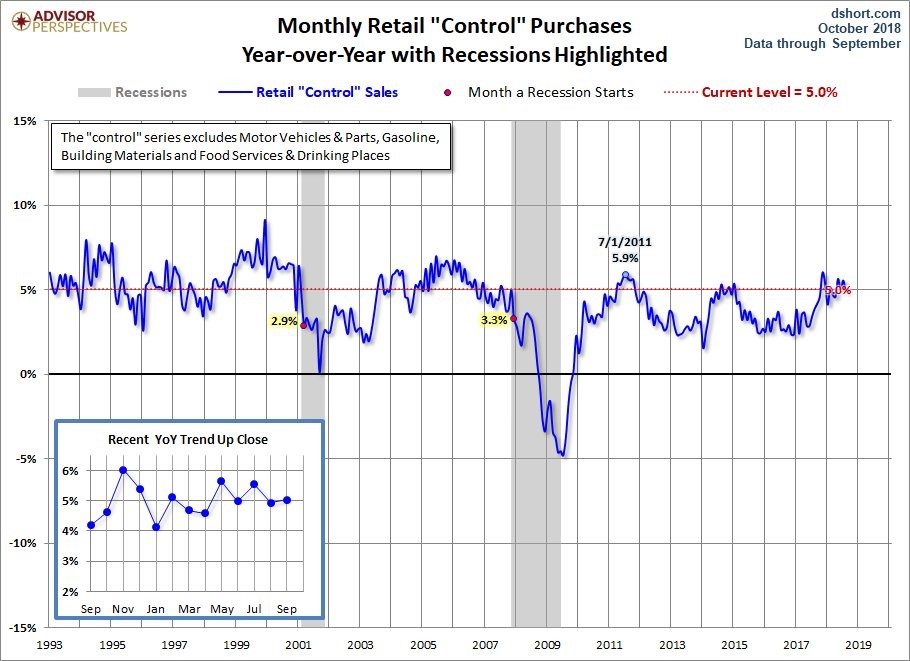
Source: Advisor Perspectives
It’s much higher than the growth rates at the start of the last two recessions which were 2.9% and 3.3%. Control group retail sales are used to calculate the personal consumption expenditures growth rate in GDP. It excludes food services, auto dealers, building materials, and gas stations.
As you can see from the chart below, the 3-month average retail sales growth was 5.94% which is the first growth decline in 6 months.
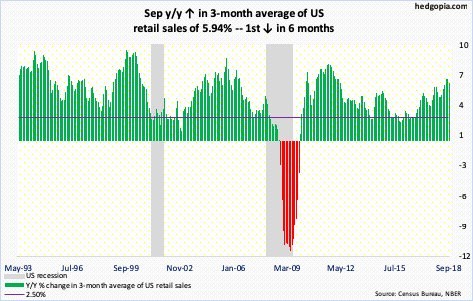
Source: Hedgopia
Auto sales were strong as they increased 0.8% month over month possibly because of replacement sales related to hurricane Florence. Monthly sales from gas stations were down 0.8% and sales at restaurants were down 1.8%. Restaurant sales had been very strong in prior months, leading us to believe the hurricane catalyzed weakness.
We won’t know the effect of hurricane Florence for sure by looking at October’s results because an even stronger hurricane Michael hit in that month. Building material sales were up 0.1%. Health and personal care store sales fell 0.3% and department store sales fell 0.8%. With online sales growing 1.1%, you can see the share gains from department stores have continued. Furniture stores also did well as growth was 1.1%.
Conclusion
Retail sales are changing and department stores aren’t keeping up causing them to lose significant market share to online stores. China has a whopping 22.1% of retail sales coming from online stores. Because online stores are more efficient than department stores, retail is hemorrhaging jobs. Sales growth in September was solid; some areas were temporarily weakened because of hurricane Florence. Control group sales, which go into the GDP calculation, beat estimates.
Disclaimer: Please familiarize yourself with our full disclaimer here.


