
One Reversal Too Many
Friday was the day when silver and mining stocks were likely to reverse based on their triangle-apex-based turning points and today is the day of gold’s apex-based reversal. Therefore, it seems likely that gold, silver and mining stocks are forming the final top for this short-term upswing, or that it is already in place. The problem with the reversal scenario is that the previous week was one big bearish reversal in the USD Index. Weekly reversals are significant and thus odds of a move lower in the USD increased substantially. This means more upside in metals and miners. What should one do with the profits from the current long position?
We opened the long positions on May 1st (just one day after cashing in profits from the previous short trade) and we tripled them on the same day, just a few hours later. Gold was trading at $1,306, and silver was trading at $16.10.
We wrote that it seemed that metals and miners would move higher in the following 2 weeks or so and this was based i.a. on the True Seasonal patterns and on the apex-based turning points for gold, silver and mining stocks. The turning point for gold is today and the turning points for silver and miners were last Friday. In short, it seems that the time for the rally is up.
Yet, the key external factor for the precious metals market – the USD Index – is suggesting otherwise. Let’s start today’s chart analysis with it and check how much it really changes (chart courtesy of StockCharts).
USD Index Reversal
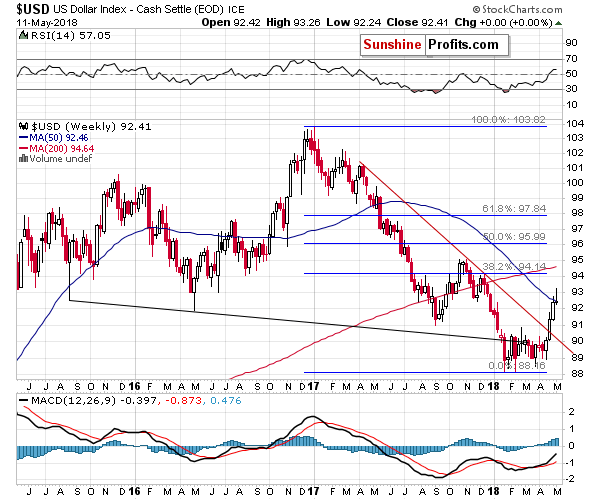
The reversal is big and clear. There’s no doubt that it’s visible from the long-term perspective. The USD Index tried to move above 93 and it failed to do so. In fact, the USD erased all the gains that it managed to achieve earlier in the week. The implications are bearish at least for this week.
Yet, does it imply that the USD Index has to move much lower?
No.
The first strong support is provided by the 38.2% Fibonacci retracement level (approximately 91.6) and it’s about 0.8 index point below Friday’s closing price. At the moment of writing these words, the USDX is already 0.17 lower, so the distance is now only 0.63 index points.
This level is a likely target also because of the analogy to the 2014 rally.
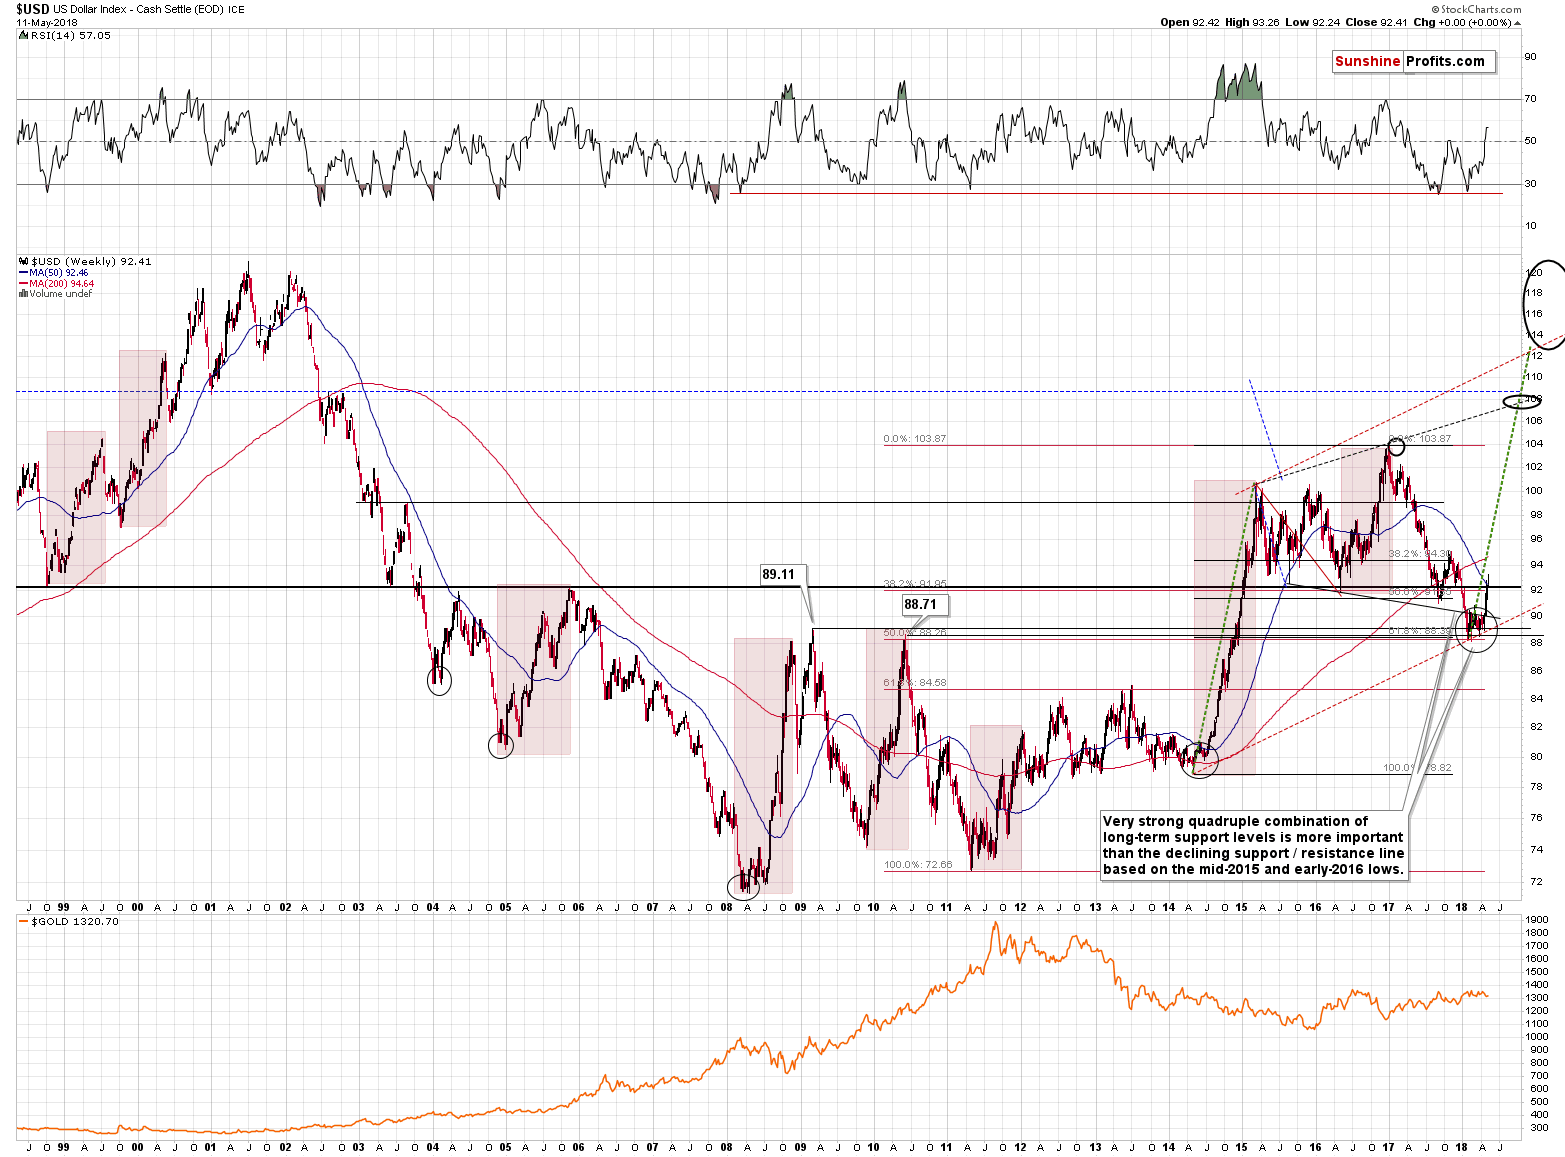
The above chart shows that last week the USD moved very close to the rising dashed green line and when that was the case in 2014, we saw the first pullback within the rally.
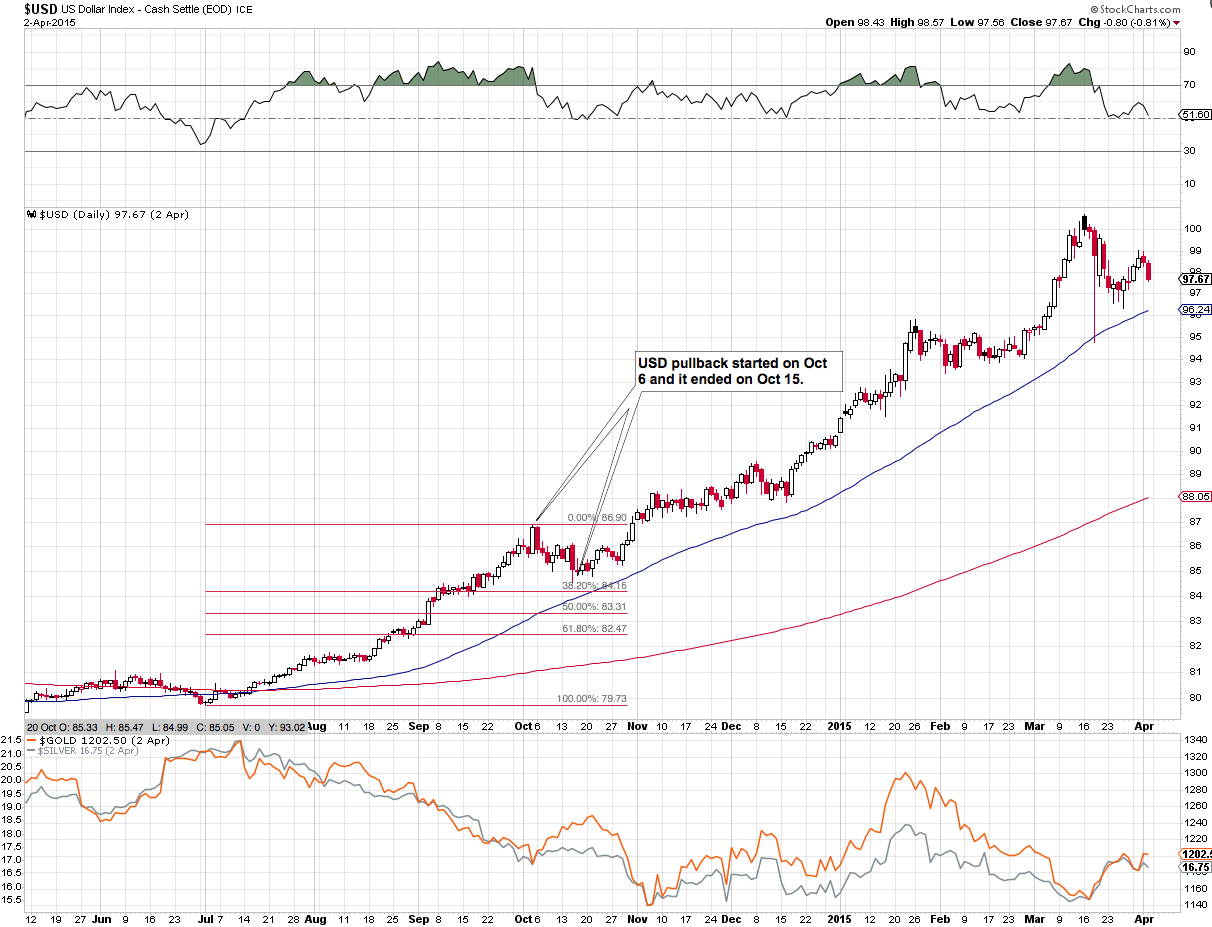
In 2014, the USD corrected to almost the 38.2% Fibonacci retracement, but only in terms of the intraday low. Therefore, if history is to repeat itself, the USD might move close to 91.6 in a sharp manner and then move back up. This would likely result in a sharp rally higher in PMs (especially in silver) and then a move back down before the end of the session.
On the other hand, please note that the October 2014 correction took more than a week to be completed and we saw the (likely) final short-term top in the USD only two days ago. This means that we could expect more weakness lasting longer than just a one-day downswing.
USD – Gold Link
Having said that, let’s move to the way in which gold, silver, and miners are likely to respond to the USD’s move to 91.6 – 92.0. It’s usually most useful to check the most recent strength of reaction and apply it to the next short-term period. Making more long- or even medium-term predictions is more difficult as the strength of the link (and even its direction) changes over time.
At the moment of writing these words, the USD Index is down by 0.17, while gold is up by $2.40. If the USD Index is to decline by another 0.63 (to about 91.6), it means that it would more than triple today’s intraday decline (multiplying it by 3.7). Applying the same multiplier to gold’s upswing provides us with an additional rally of $8.88. Gold’s at $1,320 at the moment, so the above means a move back to about $1,330.
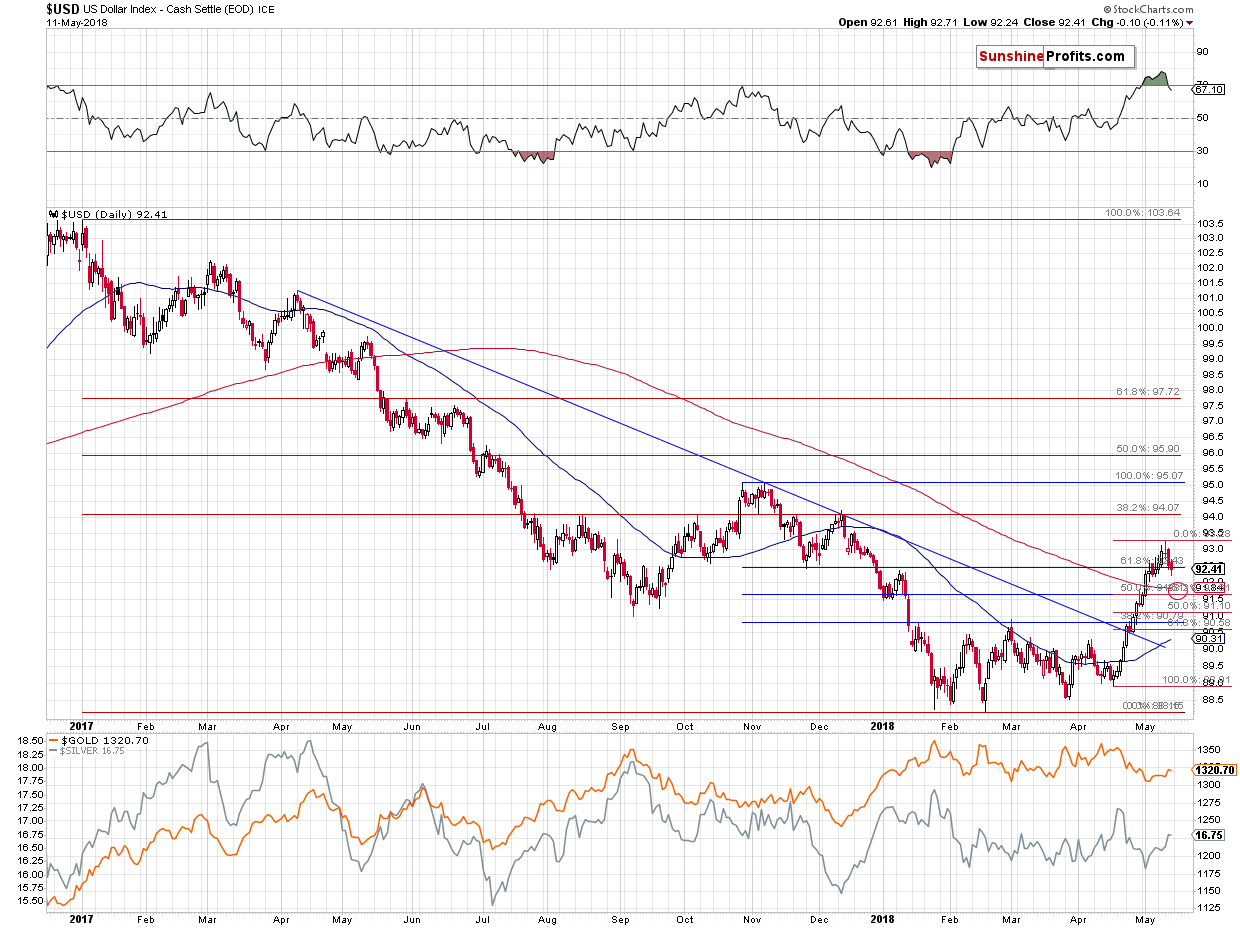
But perhaps today’s intraday moves are not representative – let’s also check Friday’s intraday movement.
The USD’s intraday high was 92.71 and the intraday low was 92.24. Gold’s intraday high was $1,326.30 and the intraday low was $1,317.00. So, the USD’s low was 0.47 lower than the high, and gold’s high was $9.30 higher than the low. If the USD is to decline by 0.63 from here, it means that the decline would be 34% bigger. The analogous move in gold would, therefore, be $9.30 * 1.34 = $12.46. On average, it still fits the scenario in which gold moves about $10 higher, to $1,330 or so and tops there.
If the USD Index continues to move lower, however, gold may move higher than $1,330. Not much higher, though. On Friday, the USD closed a bit lower and so did gold, which is a subtle clue that the rally is ending.
There are more subtle signs that confirm it.
Relative Strengths
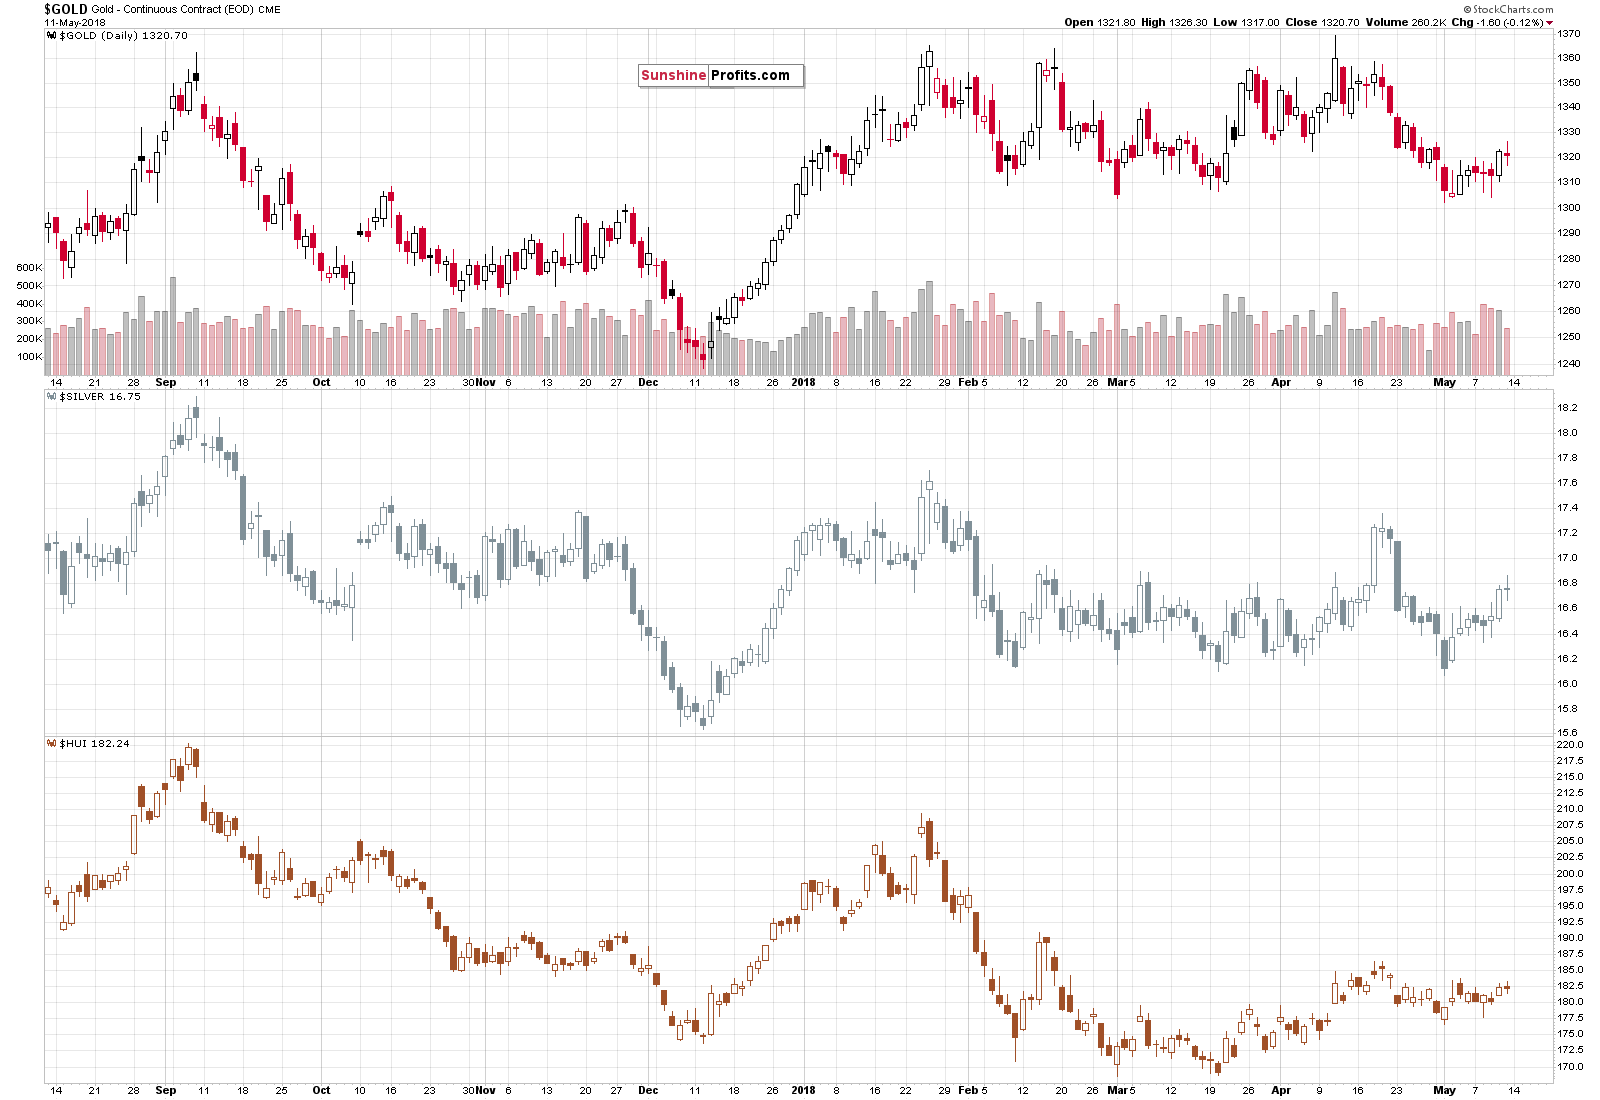
Just a brief look on the above chart is enough. Gold moved higher in a regular way. Mining stocks showed strength in the initial part of the rally. Silver, however, showed the greatest strength on Thursday and Friday.
Miners generally show strength early in the rally and silver outperforms at the end – it seems that we’ve seen the full cycle in the past 2 weeks. Consequently, the rally appears to be ending.
On a side note, you might be wondering if there is a way to somehow turn the above general observation into an indicator and… We already did that a couple of months ago. We are not featuring this indicator as we are still making sure that it’s useful, but we’ve done this with long-term investments in mind, which is likely to greatly increase their overall profitability by switching from miners to silver and vice versa close to the middle of a given move.
Having said the above, let’s move to the metals and miners themselves.
Gold’s Upside Target
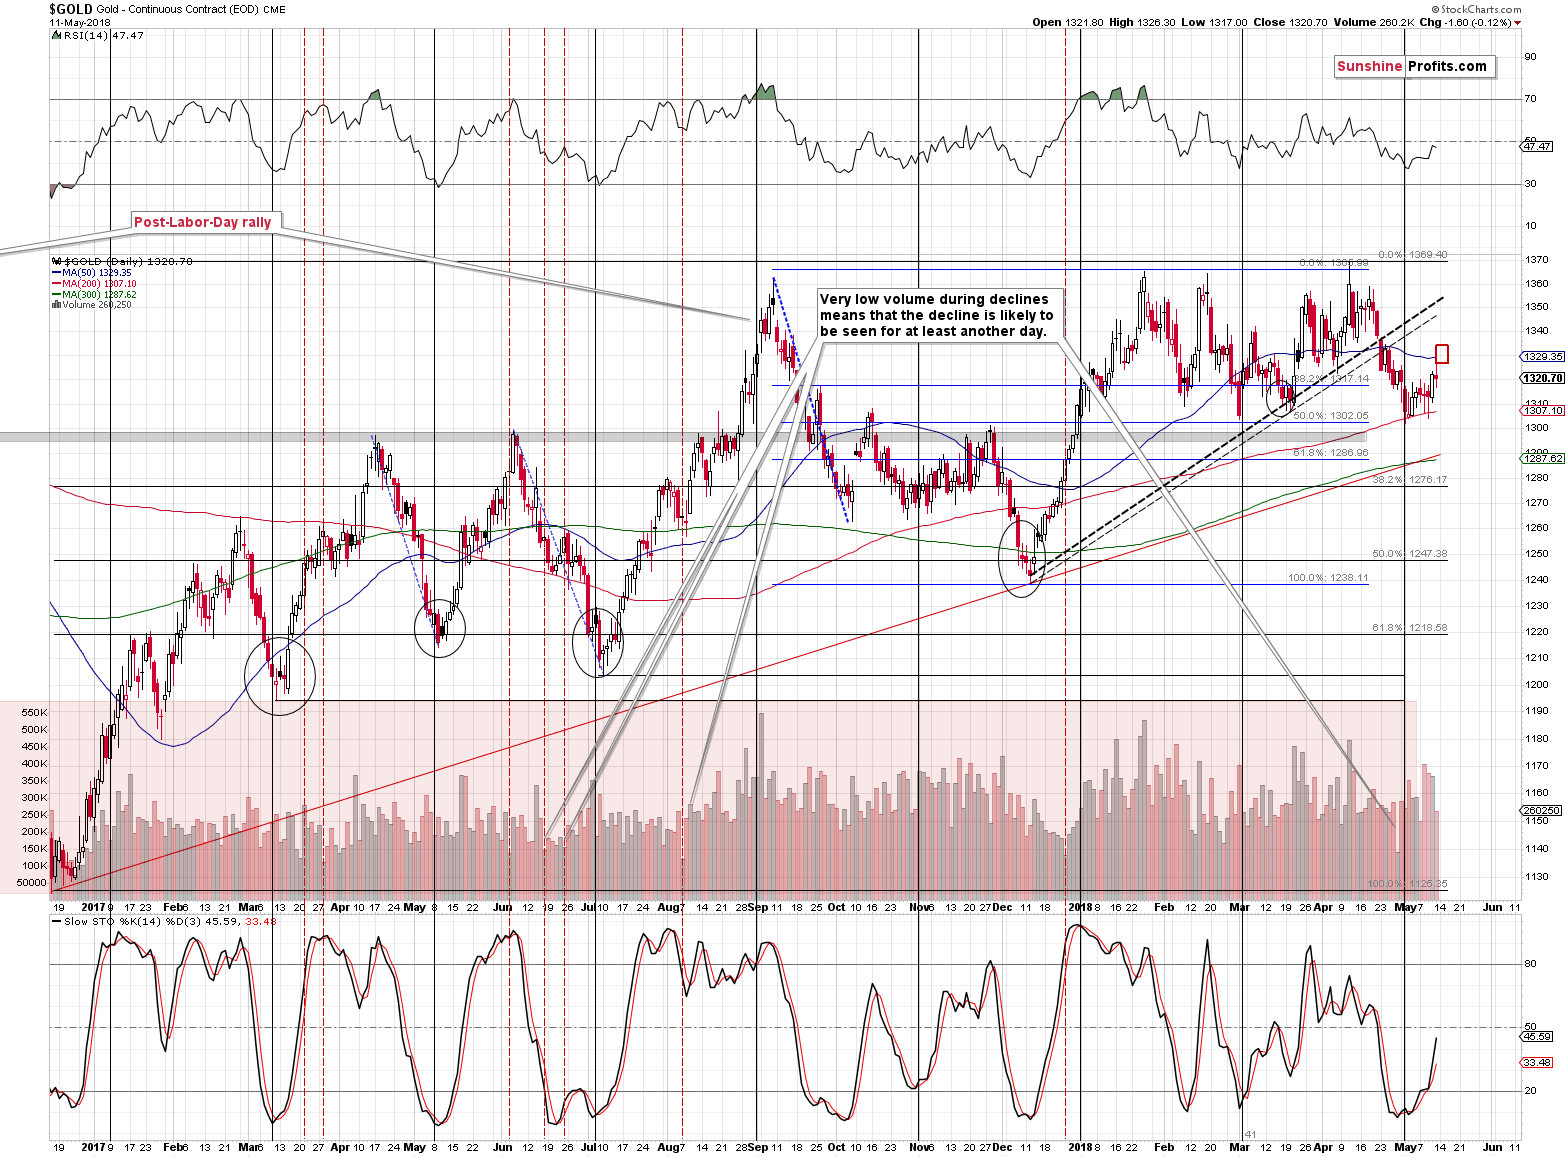
In the past 2 weeks, gold rallied, but the rally was not as big as we had originally expected. Our initial target for the rally was between $1,345 - $1,353. However, if the rally is about to end in a few days (even today), the above target is likely too high.
Based on the above and on the situation in the USD Index and its link to gold, we moved the target area lower – to $1,328 – $1,335. This target area includes the 50-day moving average. It’s a rather weak resistance level, but if the other parts of the precious metals market reach their strong resistance levels and gold is only at its MA, it would be likely to form a top there anyway. The reason is that the entire PM sector usually forms tops and bottoms at the same time, at least the very short-term ones.
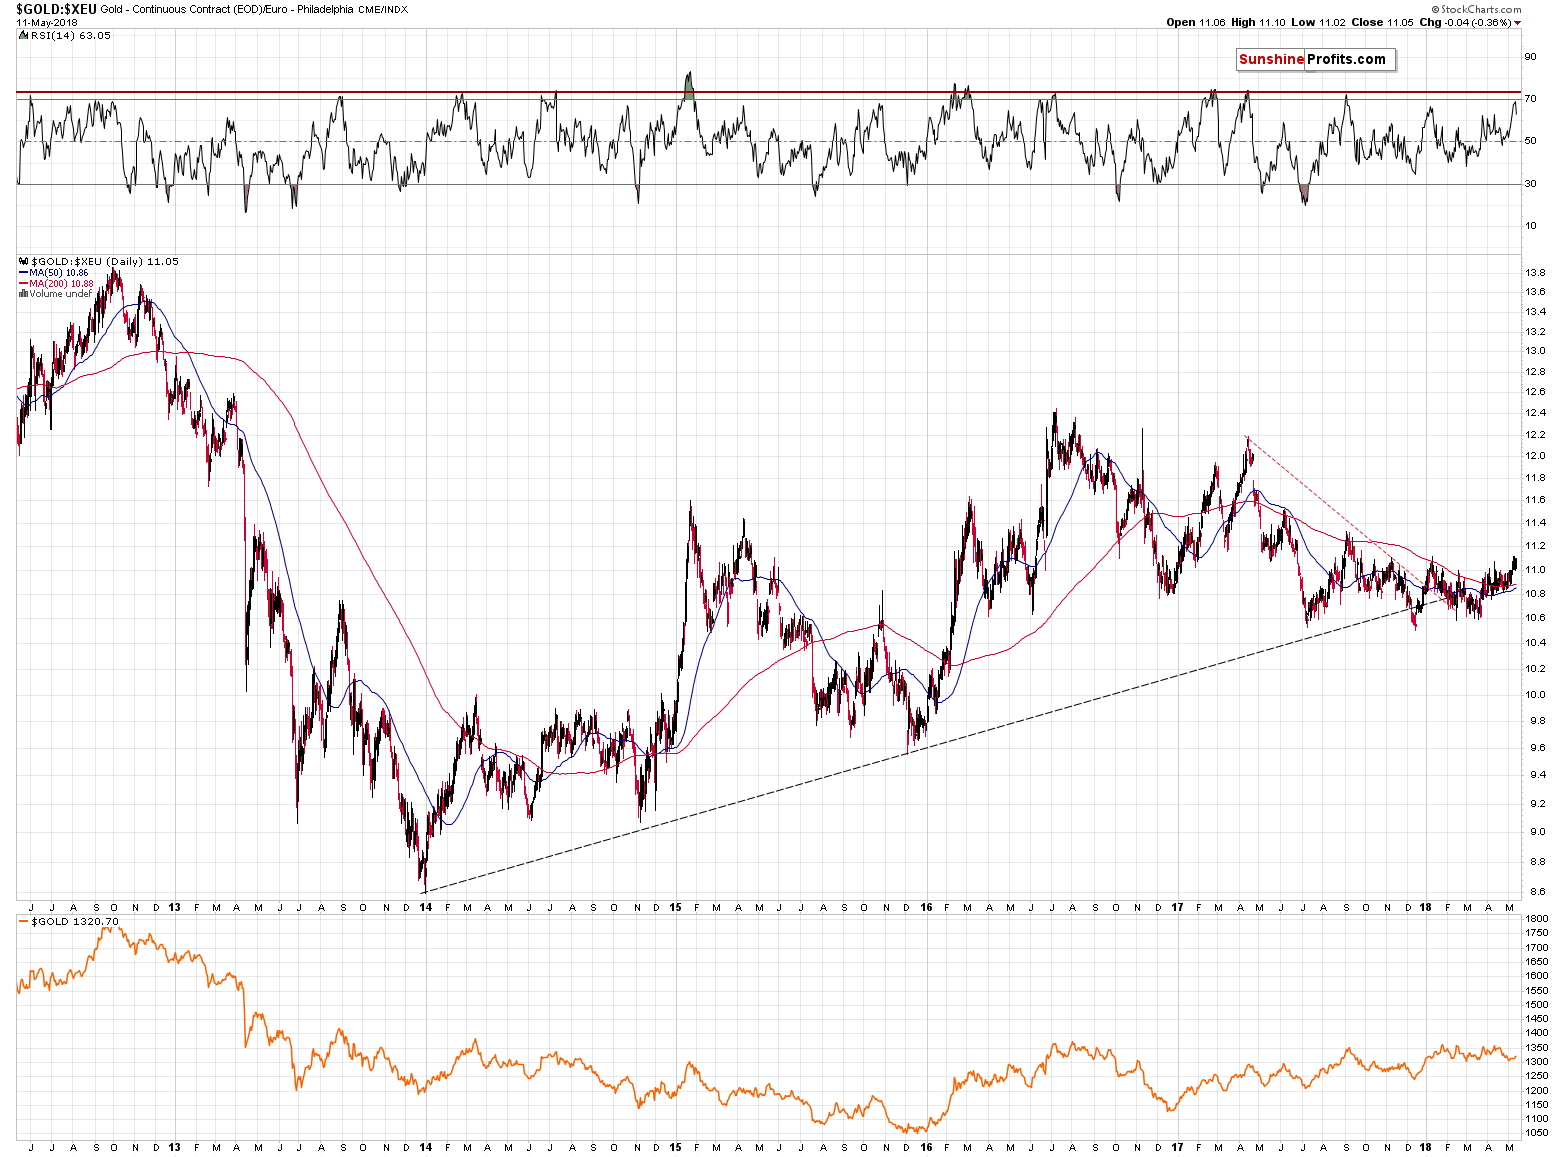
Please note that gold’s upswing this month was rather small only in terms of the USD. In terms of the euro it was quite sizable. In fact, it made the RSI indicator based on it rally above its previous 2018 high, almost reaching 70. Consequently, the rally might have been enough to make the overall sentiment bullish, convincing enough investors that the decline is over. That’s why the decline can now resume.
Moreover, let’s keep in mind that the biggest decline in recent years – the 2012-2013 one – started when the RSI based on the price of gold in the euro was just below 70. The implications are bearish.
Silver’s Upside Target
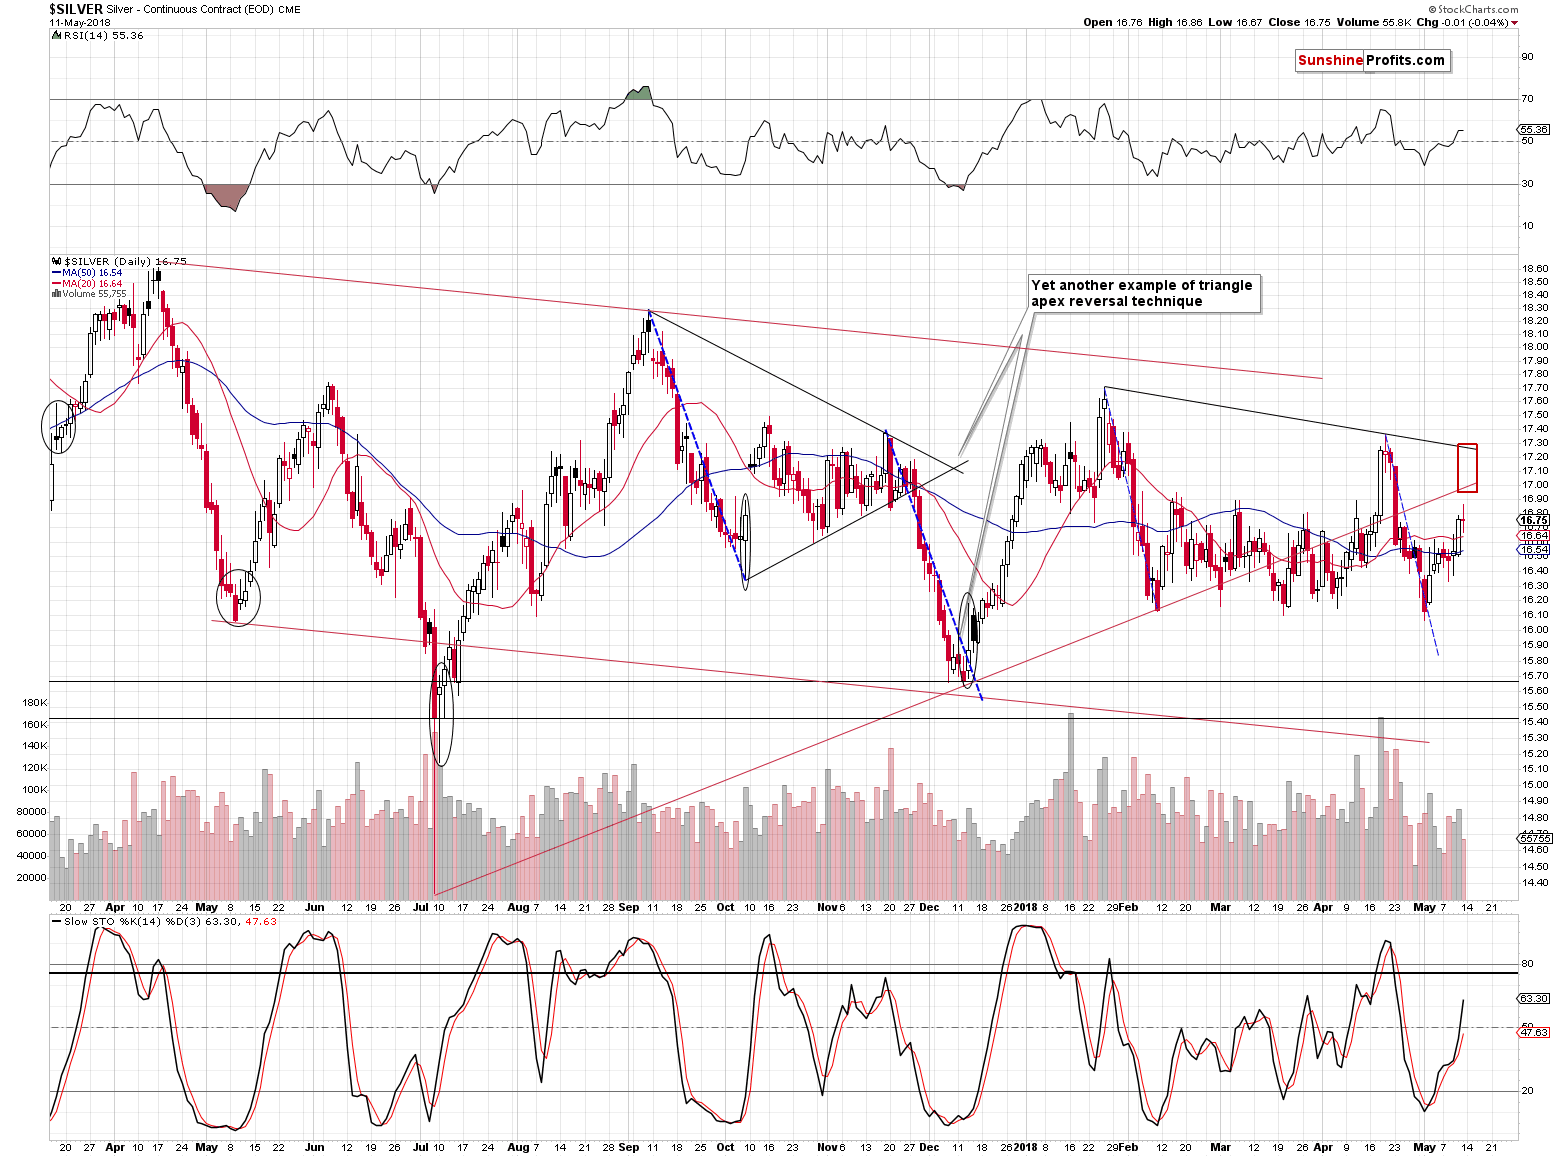
Silver’s original upside target remains up-to-date. In other words, silver’s upswing to $16.90 - $17 still seems to be the most likely scenario for the next few trading days.
As you probably noticed, the above chart features a target area that ends higher – at about $17.30. That’s not a mistake – silver is most likely to top at or a bit below $17, but we can’t forget about silver’s volatile nature, especially during local tops.
Mining Stocks’ Target
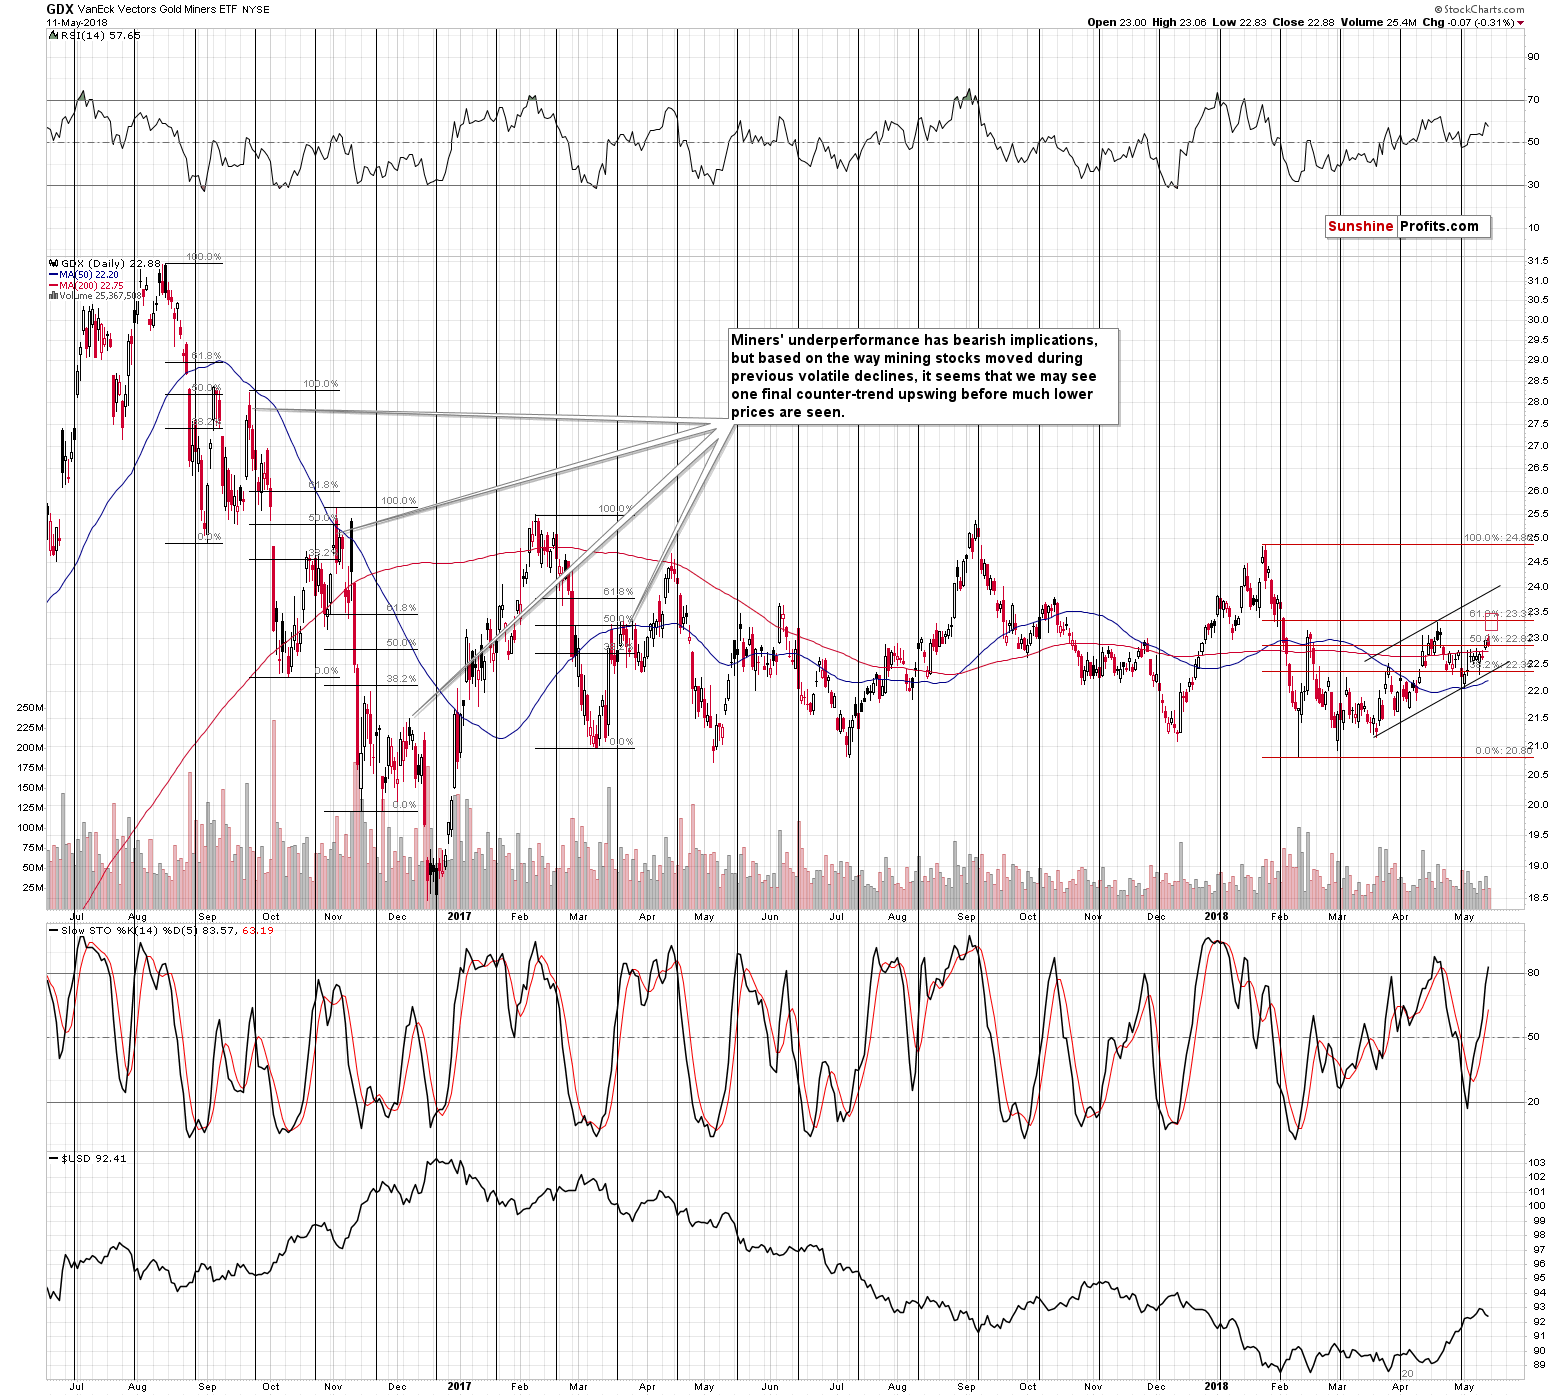
The clarity regarding the upside targets is biggest in the case of the mining stocks and there are two reasons for it.
First, mining stocks seem to have already begun to show the weakness relative to the metals’ prices. This means that whatever happens in gold and silver, the miners’ reaction is likely to be smaller. Interestingly the same thing (final stage of the upswing) makes the outlook clearer for the miners and less clear in the case of silver.
Second, GDX is very close to its strong short-term resistance. The resistance is provided by the mid-February and April highs and the 61.8% Fibonacci retracement.
Consequently, our target area is built around the above level. The GDX is likely to form a top between $23.20 and $23.50.
Summary
Summing up, based on the apex-based reversals and True Seasonal patterns for gold, silver and mining stocks, we are likely to see a local top either today or in the next few days. Both mentioned techniques: reversals and True Seasonals work on an approximate basis, so a few days of delay would not invalidate them.
Based on the way in which gold, silver and mining stocks moved higher in the past several days and on the strength of gold’s reaction to the USD’s movement, it seems that the rally is ending and that we may see only slightly higher prices in the case of gold (a $10 rally or so) and mining stocks. The situation is less clear in the case of silver as it tends to outperform during the final parts of the rallies, but it seems that expecting $17 is justified.
Please note that the above is based on the data that was available when this essay was published, and we might change our views on the market in the following weeks. If you’d like to stay ...
more

