
Once Again, 10-Year T-Yield Attempts To Convincingly Take Out 3%
The 10-year Treasury yield is at it again, trying to convincingly break out of just north of three percent. Shorts have done very well in the past year. They will mint money should a breakout occur. A lack thereof also raises the odds of a squeeze in due course.
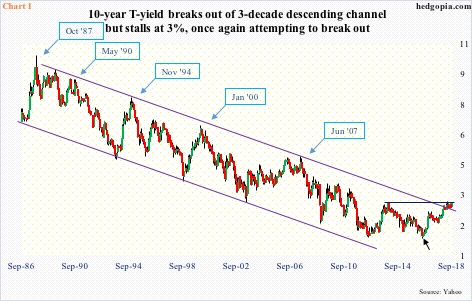
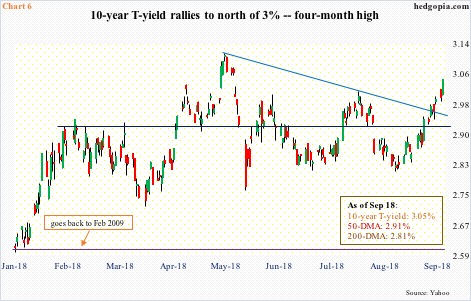
Once again, the 10-year Treasury rate is hammering on three percent. In fact, it closed Tuesday north of it – to a nearly four-month high 3.05 percent. The last time it reached that level before coming under sustained pressure was December 2013, when it retreated after hitting 3.04 percent. By July 2016, 10-year notes were yielding 1.34 percent (black arrow in Chart 1). This was a major bottom, followed by channel breakout. This is not any one of those plain-vanilla channels – goes back three decades. The breakout took place in April this year. Yields have since stayed above, but building on it has proven difficult. The culprit is resistance at just north of three percent. Hence its significance.
In the past year, the 10-year has rallied 100 basis points. Just in the past month, it has gone up 24 basis points. What could be causing this? Could China – the largest holder – be unloading its holdings? As of July, China held $1.17 trillion in Treasury securities, down $7.7 billion month-over-month. As early as August last year, it held $1.2 trillion. At the same time, holdings were merely $1 trillion in November 2016. So China likely is not a factor. At least not yet.
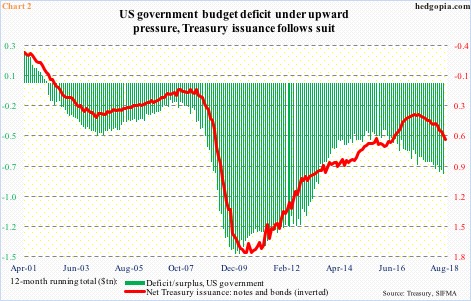
Bond bears can cite other fundamental reasons for their bearishness, one of which is the rising US budget deficit. On a 12-month rolling total basis, the deficit reached $783.8 billion in July. This was the highest since May 2013 (Chart 2). This needs to be funded. Consequently, Treasury issuance is rising. In the 12 months through August, issuance totaled $581 billion – the highest since June 2016.
Concurrently, the Fed is also cutting back on its Treasury holdings. As of last Wednesday, it held $2.16 trillion in Treasury notes and bonds, down from $2.35 trillion in October 2014. Beginning this October, the pace of reduction is set to accelerate. If this selling is not met by demand elsewhere, bonds come under pressure.
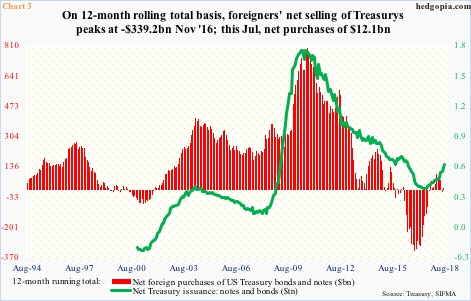
On a 12-month rolling total basis, net foreign purchases of Treasury notes and bonds were $12.1 billion in July. This is much better than net sales of $339.2 billion as recently as November 2016, but directionally the red bars in Chart 3 are not keeping up with the sharp rise in the green line. This cannot continue.
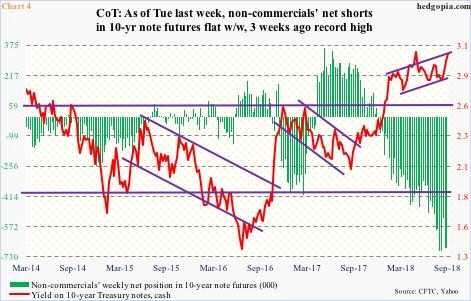
It is because of this potential supply-demand mismatch that non-commercials get emboldened to accumulate the kind of net shorts they have in 10-year note futures. As of Tuesday last week, they were net short 682,684 contracts – not that far away from record 700,514 from three weeks prior.
These are massive holdings. A year ago, they were net short 270,120 contracts. And as previously mentioned, the 10-year rate is up 100 basis points since last September. So these traders have done very well. That said, the sheer size of their holdings also raises the risk of a squeeze at some point.
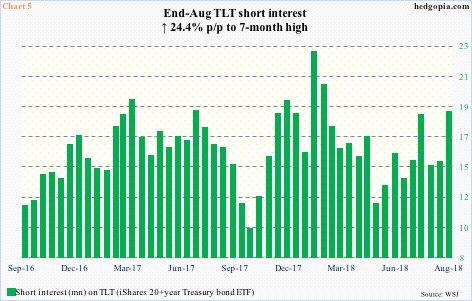
On TLT (iShares 20+ year Treasury bond ETF), there is a similar bearish sentiment in the display. As of the end of August, short interest was 18.5 million, up 3.6 million over the prior period. It is at a seven-month high. September-to-date, TLT has gone down three percent. So these shorts have fared well. But once again, the risk they face is of a short squeeze.
As previously mentioned, the 10-year T-yield sits at a crucial juncture. A convincing break out of this level has the potential to self-fulfill, taking out stops. But the question is, do the bears have more left in the tank to force a breakout?
As things stand, even if yields continue to come under upward pressure, there is that resistance from mid-May, which lies at 3.12 percent (Chart 6). The daily chart is way overbought. Bears have this advantage, though. There is decent support at 2.93 percent, followed of course by 2.62 percent. The latter goes all the way back to February 2009.
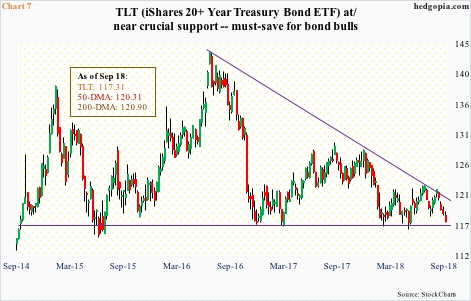
At the same time, TLT is teetering on support. As a matter of fact, the ETF has been trapped in a massive descending triangle. More often than not, this can eventually result in a breakdown, which could have massive consequences – not only for the sovereign bond market but a whole host of other assets. Thus the need to watch this level closely.
If, however, TLT begins to stabilize here – also means the 10-year rate fails to take out the resistance it faces – odds favor a decent long opportunity. In this scenario, in due course, shorts will lend a helping hand as they get squeezed. Wait and watch for now.
Disclaimer: This article is not intended to be, nor shall it be construed as, investment advice. Neither the information nor any opinion expressed here constitutes an offer to buy or sell any ...
more

