
Older Workers Account For All Net Job Growth Since 2000
from the St Louis Fed
-- this post authored by William Emmons, Lead Economist, Center for Household Financial Stability
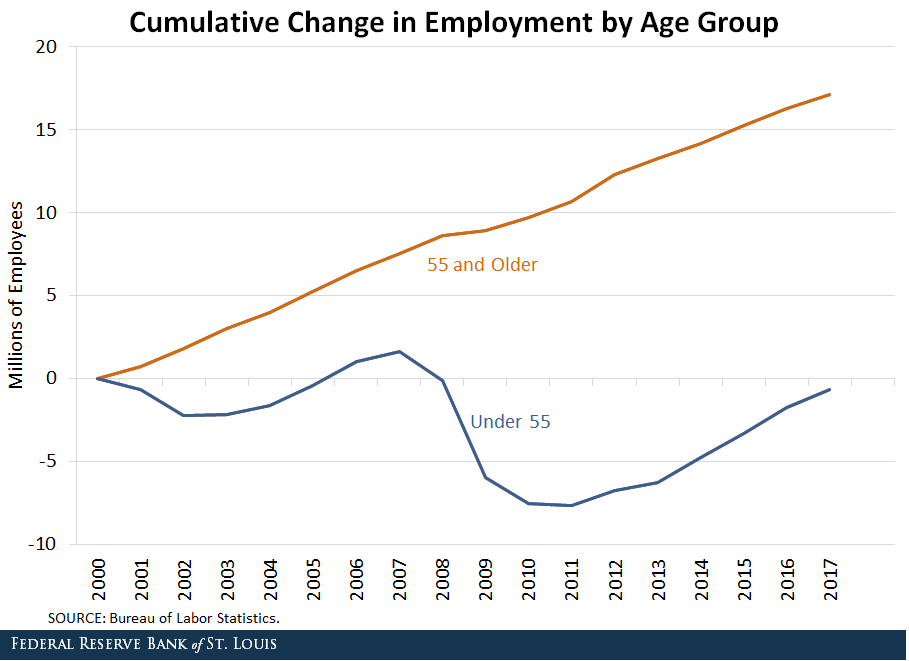
“Prime-age workers" are those between 25 and 54.[ 1] Numbering almost 100 million in December 2017, this age group is both the largest and most productive set of workers.[ 2] Yet, all of the net increase in employment since 2000 - about 17 million jobs - has been among workers aged 55 and older, as seen in the figure below. Some economists fear that our aging workforce may be holding back economic growth.[ 3]
(Click on image to enlarge)
One important consideration on this topic is that the rapid aging of our workforce is unlikely to continue at this pace. Two important trends contributed to the rapid increase in the share of employment of older workers shown in the chart:
- A rapid increase in the share of older people in the population
- Diverging employment-to-population ratios by age group
The share of the U.S. adult population aged 55 or older increased from 27 to 36 percent between 2000 and 2017. This rapid change, due to the aging of the baby boomers, is unprecedented and is not expected to continue.
At the same time, the employment-to-population ratio of people aged 55 or older increased from 31 to 39 percent, while the ratio declined from 77 to 72 percent among people under 55. It seems unlikely, although not impossible, that these trends will continue to diverge so significantly.
Future Share of Older Workers
It is possible to forecast future employment shares by age group using Census Bureau population projections of detailed age groups and assumptions about future employment-to-population ratios.
For simplicity, I assumed that the age-specific employment-to-population ratios in the fourth quarter of 2017 will remain constant in the future. The results for employment by age group are shown in the table below for two break points - age 55 and age 65.
| Employment by Age Group in Millions | |||||
|---|---|---|---|---|---|
| Over and Under Age 55 | |||||
| 2000 | 2007 | 2017 | 2027 | 2037 | |
| Under 55 | 119.2 | 120.0 | 118.5 | 128.8 | 136.2 |
| 55 or Older | 18.4 | 26.2 | 35.5 | 40.0 | 40.3 |
| As Percent of Total | 13.4% | 17.9% | 23.1% | 23.7% | 22.8% |
| NOTES: Employment projections are based on Census Bureau projections of population by age group and age-specific employment-to-population ratios as of Q4:2017. Numbers are as of December each year. | |||||
| SOURCES: Bureau of Labor Statistics for 2000, 2007 and 2017 and author's calculations for 2027 and 2037. | |||||
| Federal Reserve Bank of St. Louis | |||||
| Employment by Age Group in Millions | |||||
|---|---|---|---|---|---|
| Over and Under Age 65 | |||||
| 2000 | 2007 | 2017 | 2027 | 2037 | |
| Under 65 | 133.5 | 140.5 | 144.5 | 154.5 | 161.4 |
| 65 or Older | 4.1 | 5.8 | 9.5 | 14.2 | 15.4 |
| As Percent of Total | 3.0% | 4.0% | 6.2% | 8.4% | 8.7% |
| NOTES: Employment projections are based on Census Bureau projections of population by age group and age-specific employment-to-population ratios as of Q4:2017. Numbers are as of December each year. | |||||
| SOURCES: Bureau of Labor Statistics for 2000, 2007 and 2017 and author's calculations for 2027 and 2037. | |||||
| Federal Reserve Bank of St. Louis | |||||
The first table shows that workers 55 and older are likely to become a slightly larger share of the workforce by 2027, but the share likely will decline after that. The second table shows that workers 65 and older are likely to become a larger share of the workforce over the next 20 years.
Long-Term Workforce Changes
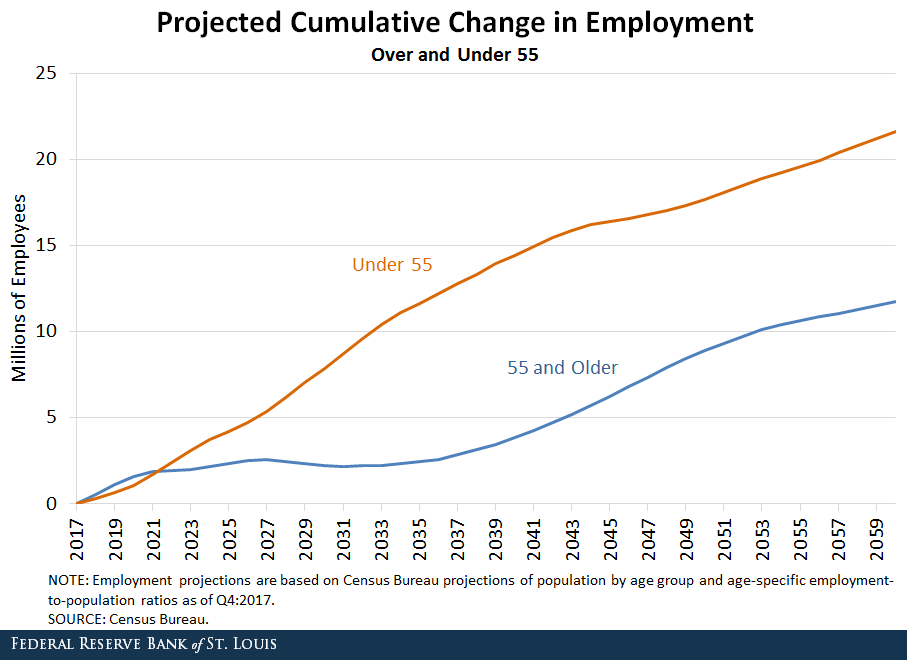
The figures below show long-range projections of cumulative increases in employment for older and younger workers, using first age 55 and then age 65 as break points.
(Click on image to enlarge)
(Click on image to enlarge)
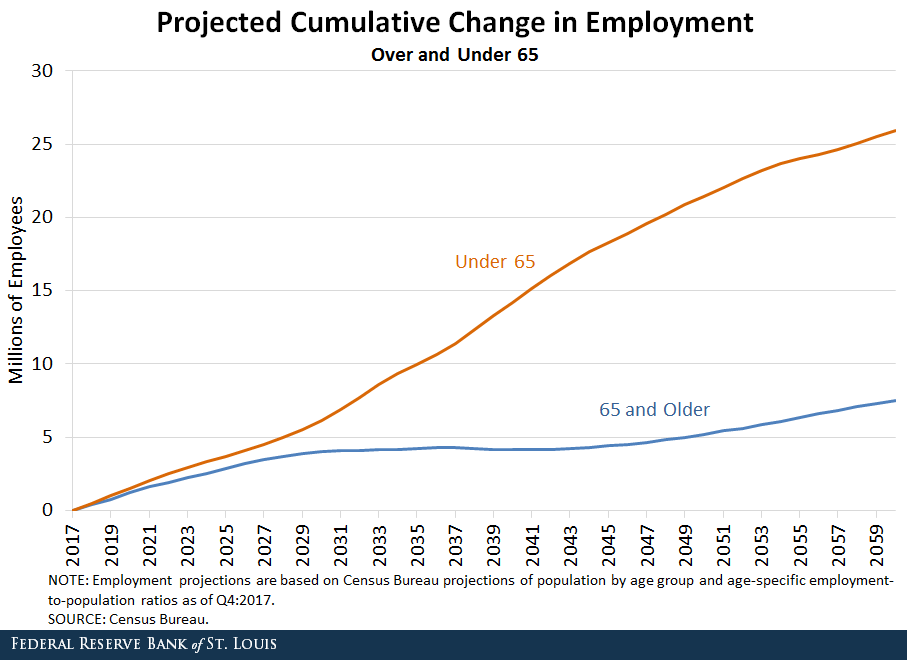
As the results in the tables suggested, the figures also show that the rapid increase in workers age 55 and older (or 65 and older) likely will not continue to outstrip younger workers for long. Within a decade or so, growth of younger workers (however defined) will once again begin to outstrip the growth of older workers.
A Silver Lining to the Graying of the Workforce
If it’s true that our aging workforce has held back economic growth in recent years, then the likely return to more normal patterns of job growth by age group is a reason to be optimistic. The Census Bureau expects the age structure of the population to shift permanently toward an older population, but the most rapid changes relevant for the workforce will have occurred within the next decade or so.
Disclaimer: No content is to be construed as investment advise and all content is provided for informational purposes only. The reader is solely responsible for determining whether any ...
more

