
Oil Update - Monday, Sept. 17
We are up 86% in this trade and I think there is another jump higher in oil prices coming.
“Davidson” submits:
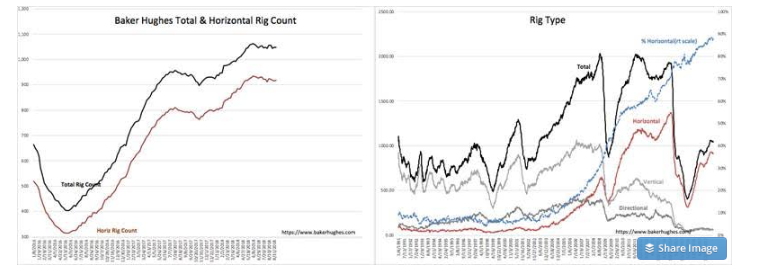
Many use activity indicators to provide investing insight. The rig count is one of these. The issue is that indicators represent a simple view of dynamic conditions which often make simple interpretation misleading. The rig count is one of these. Efficiencies have boosted rig productivity to such a level that my contacts indicate rig in use now represents 1.5-2x the output of 4yrs ago. This means that US production at record levels today, 11mil BBL/day, are occurring with ½ the rig count, 1044 today vs. 2012 level of 2008, when production was 5.58mil BBL/day. The horizontal rig count, a more efficient recovery method, similarly shifted from 57% to 88% of the rig count since 2012.
Innovation is a dynamic process. It is everywhere in a Free Market society. Fracking is now producing 2x the output with roughly ½ the input. The Baker Hughes rig count appears to be stalling, but it actually reflects significant efficiencies achieved by E&P cos. With companies like SDPI boosting efficiencies per rig with innovative drilling tools, seeing the rig count flatten is not surprising. There is another relationship between US Crude Inventories and the 5yr avg which has driven market psychology and $WTI that may prove useful at this time.
(Click on image to enlarge)
Rising $WTI reflects a mix of market inputs.
1) The data shows a steady rise in consumption due to the current global economic expansion.
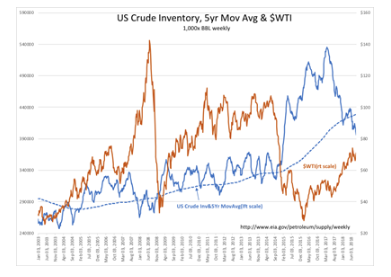
2) Market psychology has also driven prices higher as US current inventories fall below the 5yr mov avg US Crude Inventories. There has been an inverse relationship imposed by trading algorithms since 2003 with the US$ strength/weakness. This no longer appears dominant.
The spread between US Crude Inventories and the 5yr mov avg has widened to ~35mil BBL. Market psychology drives $WTI higher when current inventories fall below the 5yr mov avg. The greater the negative spread in current inventories vs 5yr mov avg the higher market psychology drives $WTI. $WTI should move higher with every report the next few weeks as global demand, US exports appear strong. Higher $WTI always supports stronger E&P activity.
(Click on image to enlarge)
There is nothing simple about using single indicators to assess economic activity when innovation dynamically changes cost structures.
Disclosure: The information in this blog post represents my own opinions and does not contain a recommendation for any particular security or investment. I or my affiliates may hold positions or ...
more

