
Oil Trade Update
Plunger’s “trade of the year” is an attempt to get in front of the dynamics of a weakening economy. The oil price is very sensitive and is one of the leading indicators of the economy. I initiated my original short position back in the first week of March as it broke down from $54. I have traded 2 separate legs down and partially covered near the bottom of the second leg. Today I began to rebuild my short position at today’s opening surge. The price pop was a reaction from the announcement that the OPEC agreement would be extended. The only surprise was in the timing as the market expected this but not until May 25th. Nevertheless it put on a short lived celebration.
Of course this was an important news event, however I am inclined to regard it as noise. I find it much more useful to trade the chart and therefore see this simply as a completion of a backtest move. If anything it validates the original interpretation that this is a failing rally as today's action appears to be a false break over resistance and it immediately retreated back into its trading range.
(Click on image to enlarge)
Above: Price unable to hold above the lower triangle so far.
(Click on image to enlarge)
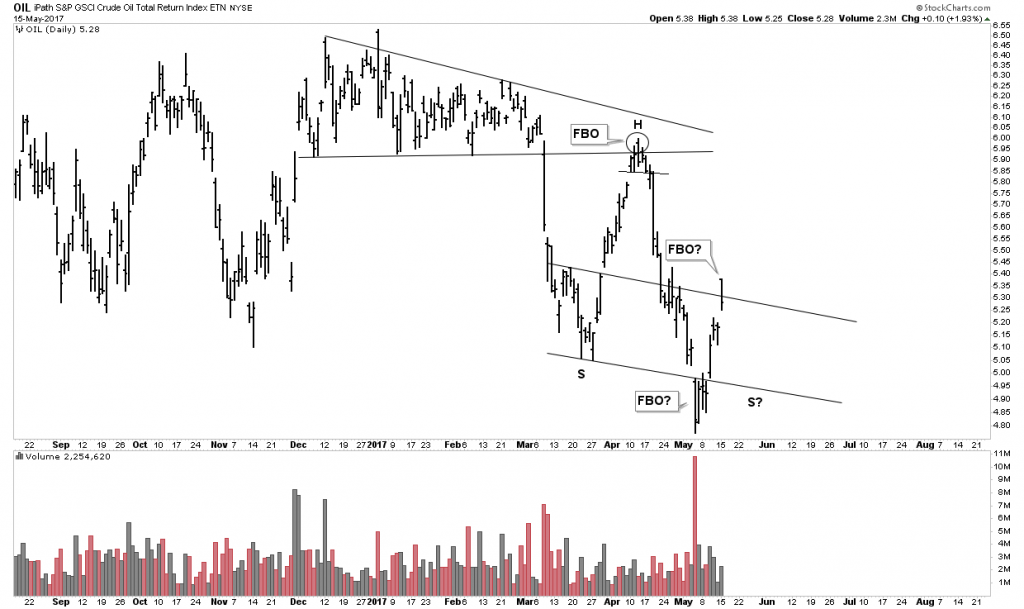
Above: Price immediately getting sucked back inside its trading channel. Possible H&S building now?
(Click on image to enlarge)
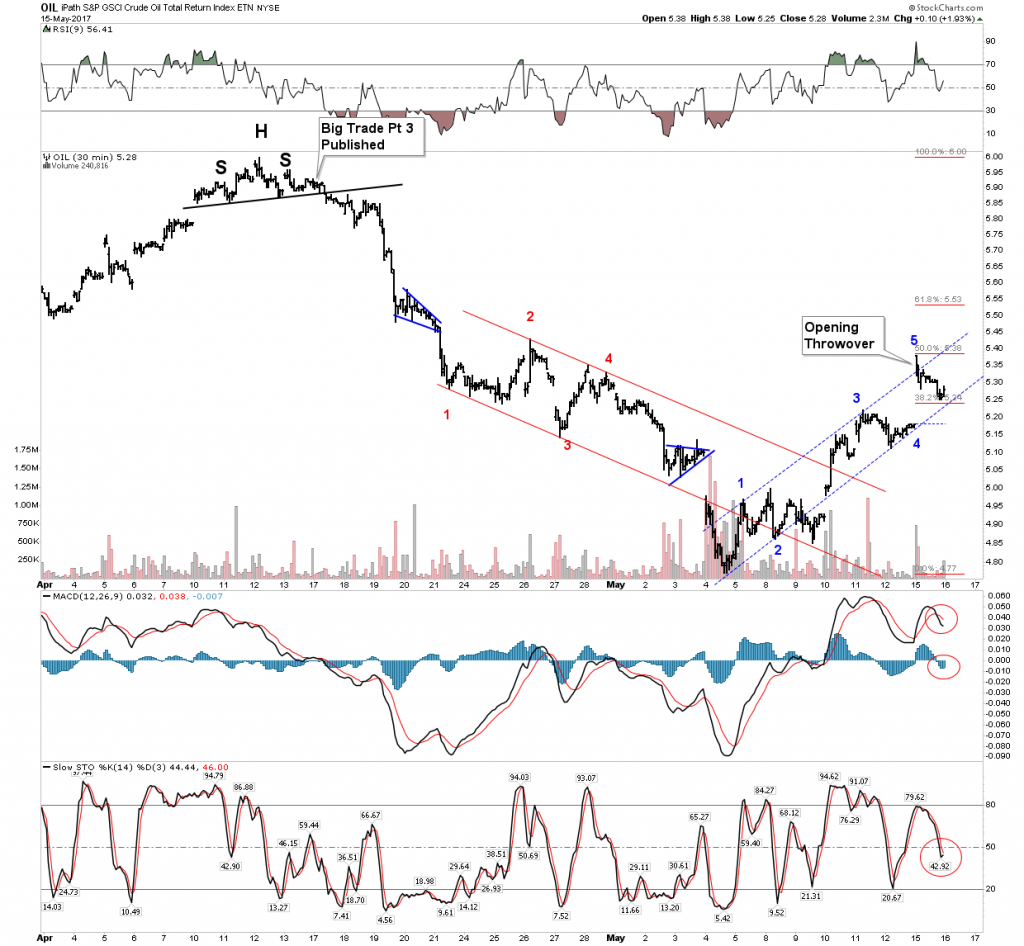
Above: Was today a perfect 50% Fib retracement of this latest leg down?
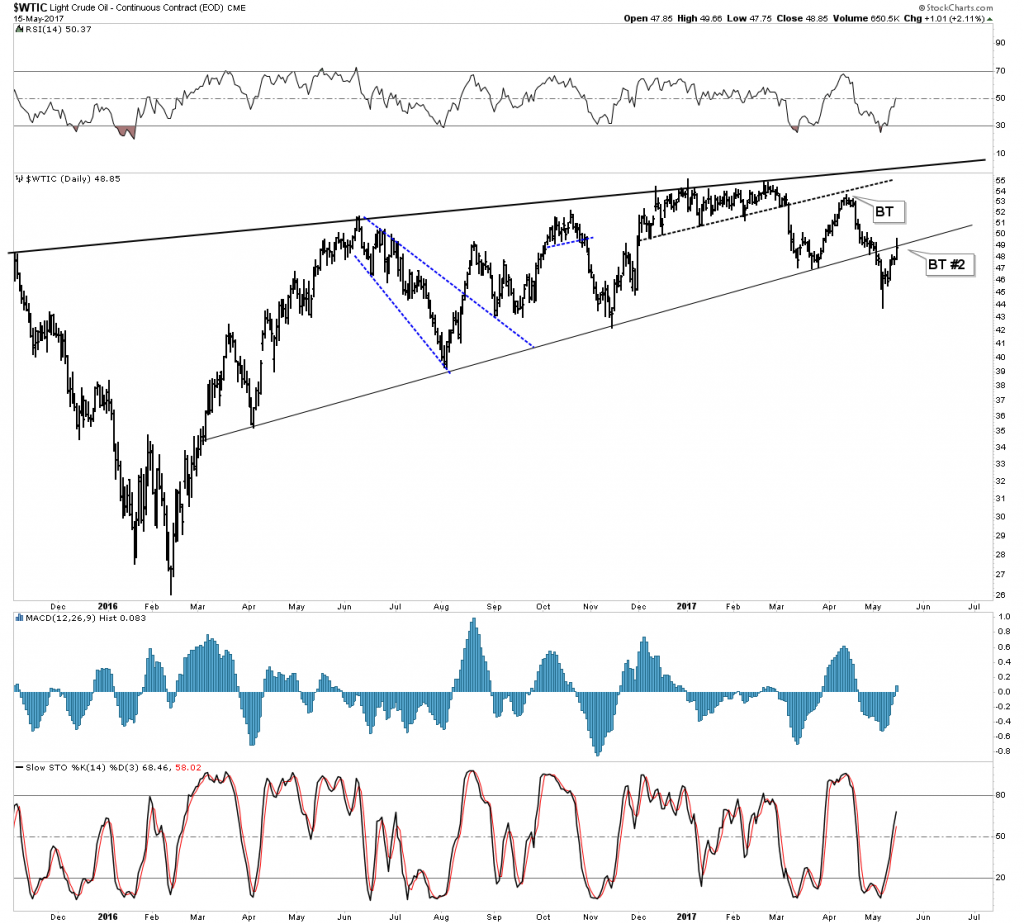
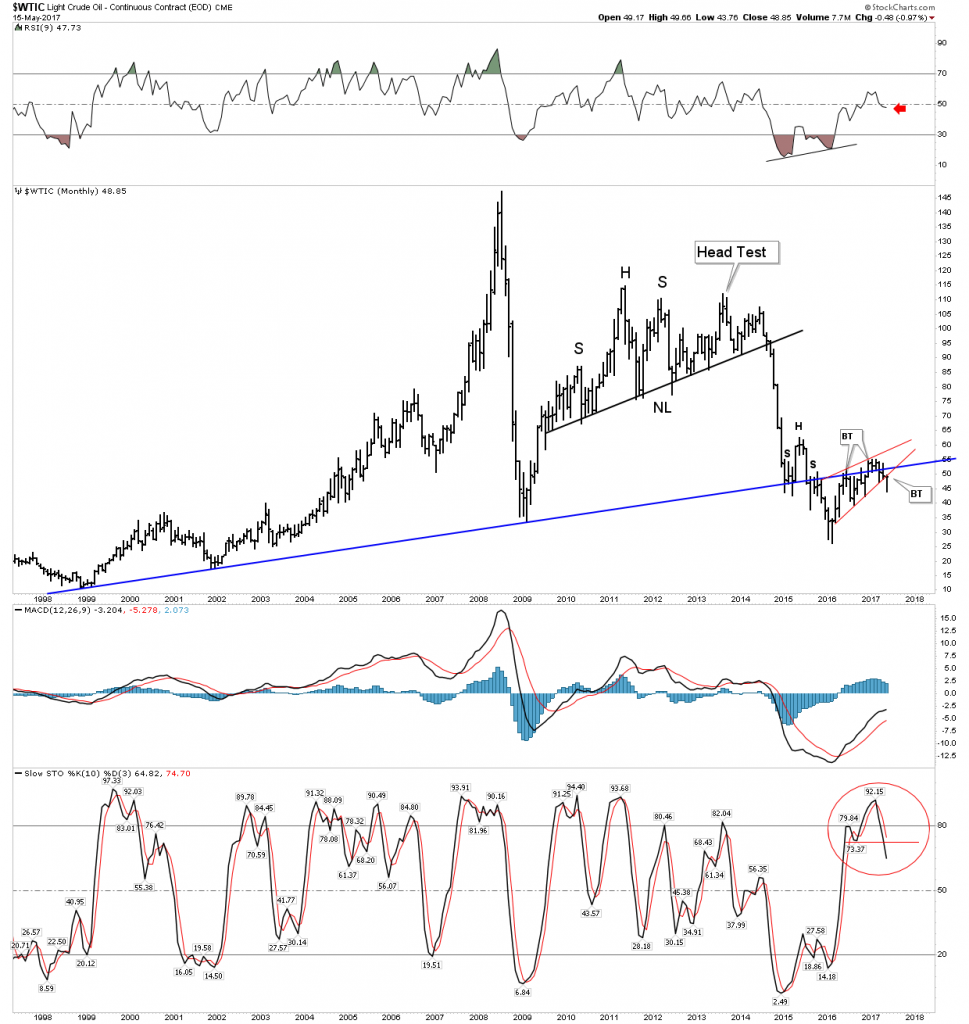
Below is the big picture linear view. Recall the principle of building out important patterns on both sides of a trend line. In this case they are both bearish. Knights step back and look at this chart from a distance, it looks to me like it has $25 written all over it.
(Click on image to enlarge)
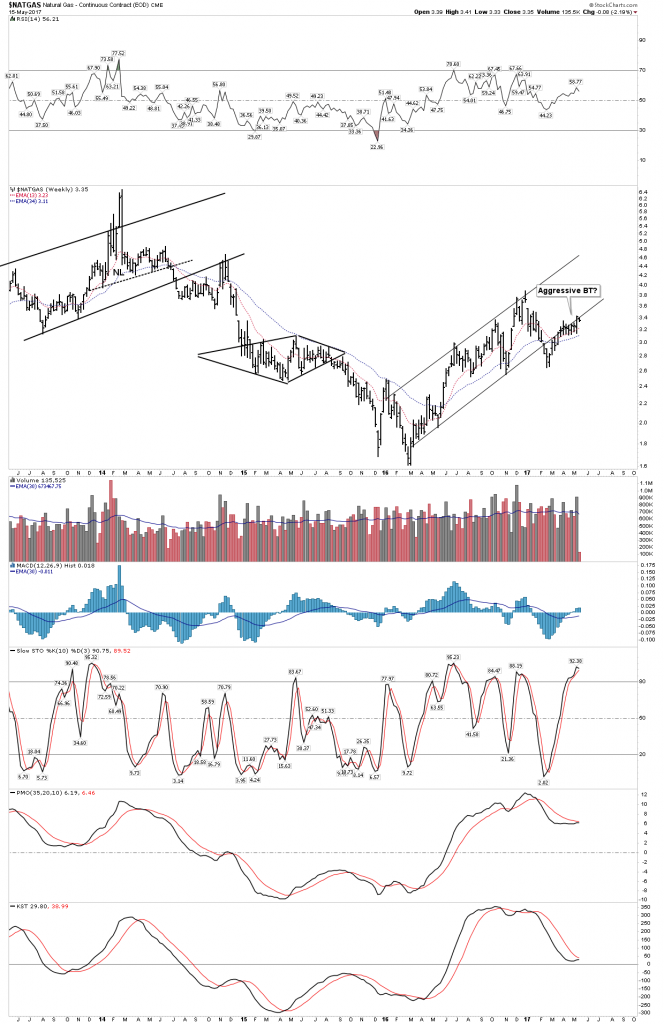
Rambus updated the NATGAS sector earlier today. Here is a different view but is still consistent with his interpretation. First a long term view of an aggressive complex back test.
(Click on image to enlarge)
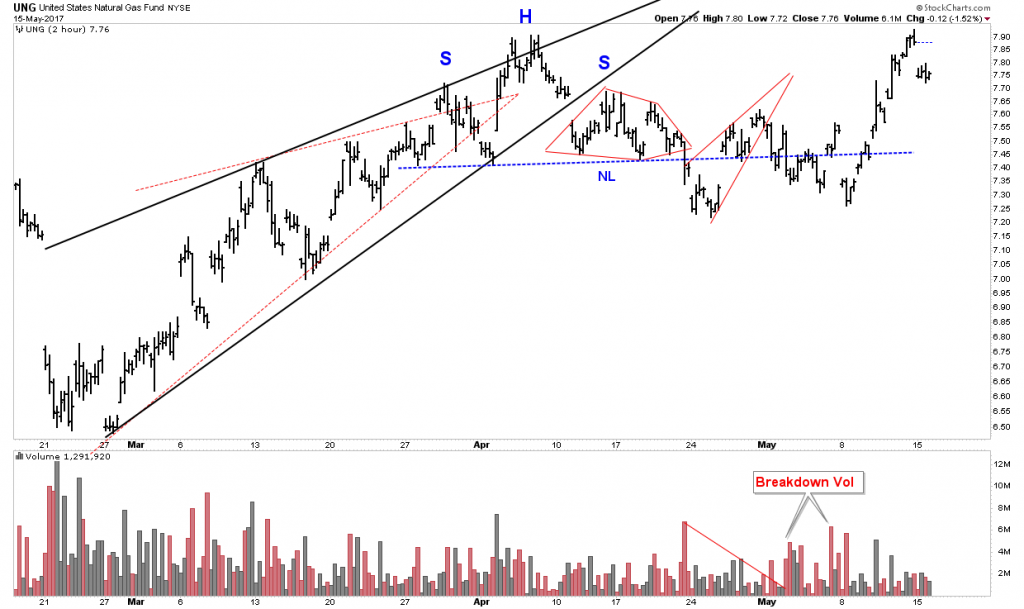
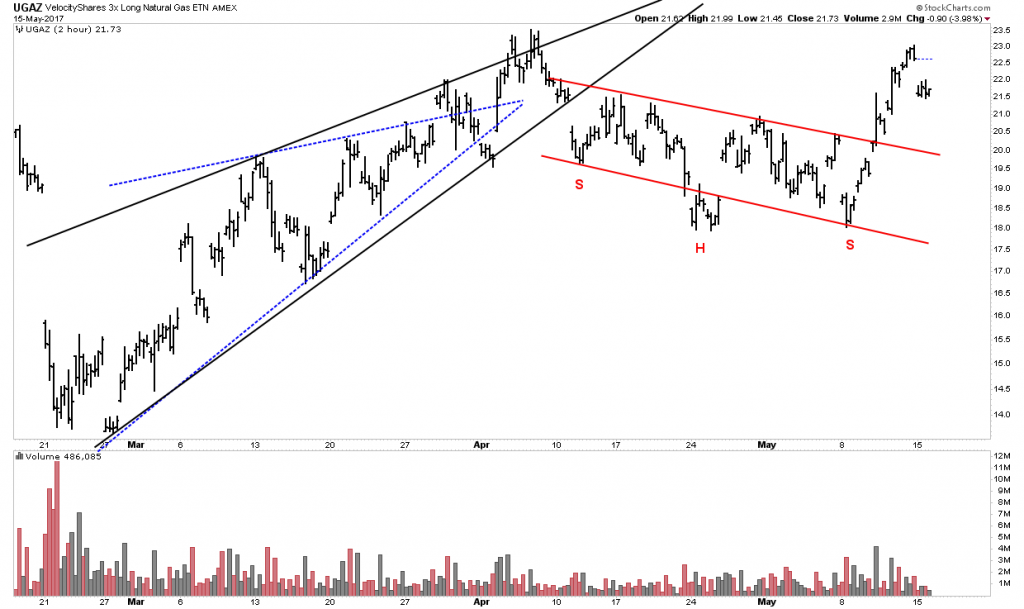
Next we have two views of NATGAS one UNG, one UGAZ, same chart, different interpretations. The first chart shows our classic two patterns (red) on the trend line (NL). It’s a bearish set-up, but what’s this?… a spike higher apparently invalidating the set-up? I wonder, however if this is instead a classic head test (bull trap). Often before a downward impulse the market cleans out short interest with one last spike rally. It has spent the past 2 months filing out out a complex BT and before it completes the move just maybe it had to clean out the shorts before it enters a downward move. Remember Mr. Bear accepts no free riders.
(Click on image to enlarge)
Disclosure: None.


