
Oil Price Closing In On Fourth Straight Weekly Gain, Gold Price Stable At $1,250/oz
Crude Oil continues to trade near the $50/bbl. Given Thursday’s U.S. DoE Inventory showed a rise in aggregate U.S. Crude Inventories of 4.85Mb/l vs. expectations of 2Mb/l, it’s encouraging to think we could see more upside. Another key driver for Oil could be the Intermarket relationship it holds to the US Dollar. If the US-Dollar can fall from ~7-month highs, that could further support the price of Oil whereas a breakout in USD may be a persistent headwind for Crude.
We are unlikely to get hard information regarding OPEC and Russia’s discussion regarding OPEC levels. They will meet in Vienna later this month before the formal OPEC meeting in November. A positive development in balancing the oversupply in Oil was noted yesterday that China’s Crude Oil exports had hit a record high. Therefore, an agreed-upon production cut with rising demand from China could continue to support and lift the price of Oil higher.
Lastly, data from Bloomberg shows that the front-month contract of WTI is trading with its lowest implied volatility since June 2015. At that time, Crude Oil was oscillating near $60/bbl.
Gold prices are steady near four-month lows near $1,250/oz. Much like Crude Oil, the stability of Gold near $1,250 is encouraging given the recent run in USD has not put further pressure on the precious metal. Despite the recent $100/oz drop over the last two weeks, intuitions are still believers in the yellow metal. Commerzbank AG noted that they had seen renewed inflows of almost two tons into gold ETFs, and Credit Suisse continues to believe in their 12-month forecast of ~$1,450/oz.
Platinum has not fared well either recently. Over the last two months, it has fallen by ~$270/oz and has recently registered a bear market by falling ~22%.
GOLD TECHNICAL ANALYSIS –The rudder on Gold’s ship, for now, looks to be the 200-DMA at $1,263.98/oz. Until the price of Gold closes above the 200-DMA, it will remain too early to say whether or not the drop from September 21 in the price of Gold by $100/oz is over. From a technical perspective, today’s slowdown may be a short-term consolidation before the next leg lower that could be triggered by another strong advance in the USD. Another short-term indicator to watch, which should discourage short-term bullishness is the 10-DMA, which can keep traders out of trouble by not fighting short-term momentum. The 10-DMA is also at $1263/oz.
However, the next leg lower has a log of support near the March/May low price zone of $1,215/1200 per oz. zone. As of Thursday, the price is sitting near the 38.2% retracement of the December-July range at 1,249. The a strong breakdown on the back of risk-on sentiment or a stronger US Dollar like we’ve seen over the last two weeks could quickly take us down to the next zone of support where we see the 50% retracement of the 2016 move higher.
(Click on image to enlarge)
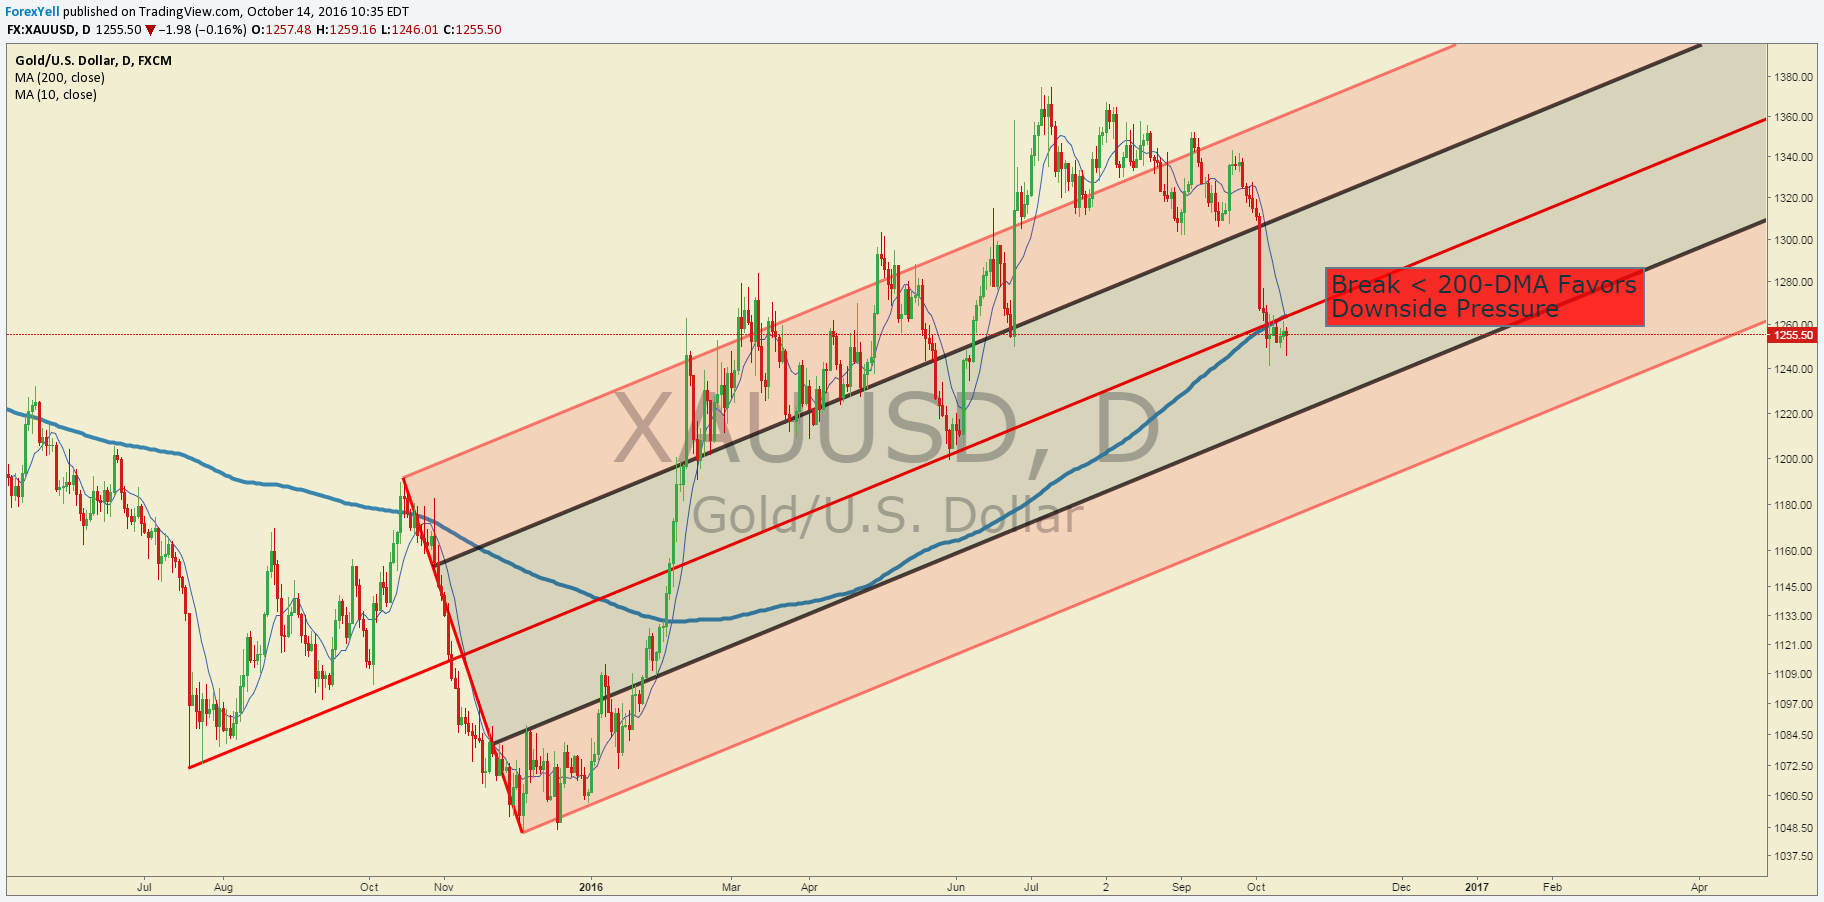
Chart Created by Tyler Yell, CMT. Courtesy of TradingView
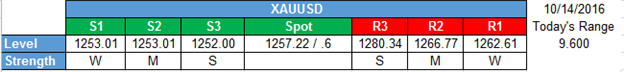
Short-Term Gold Price Support & Resistance Levels:
(Click on image to enlarge)
CRUDE OIL TECHNICAL ANALYSIS– Crude Oil prices continue to oscillate around $50/bbl on Friday. The good news for Bulls is that the pressure of the aggressive rise of nearly 5M barrels of inventory from the DoE data does not appear to be worrying traders who are hoping for 2016 highs in coming days. The consolidation for a majority of the week may worry some, but the larger picture chart below shows we’re working on a fourth straight week of gains.
Since September 21, Crude Oil prices have remained the 10-DMA on a closing basis and above trendline support drawn from the February and August lows. The trendline sits below spot at ~ $46/bbl. While a close below the 10-DMA may shake the Bull’s confidence, a hold above the trendline should favor a Bullish bias.We continue to watch the shorter-term support level of Monday’s low at $49.12 that resulted in a Bullish Key Day. The next zone of support is the 38.2-61.8% retracement zone of the September 27- October 10 move higher between $48.76-$47.02/bbl.
(Click on image to enlarge)
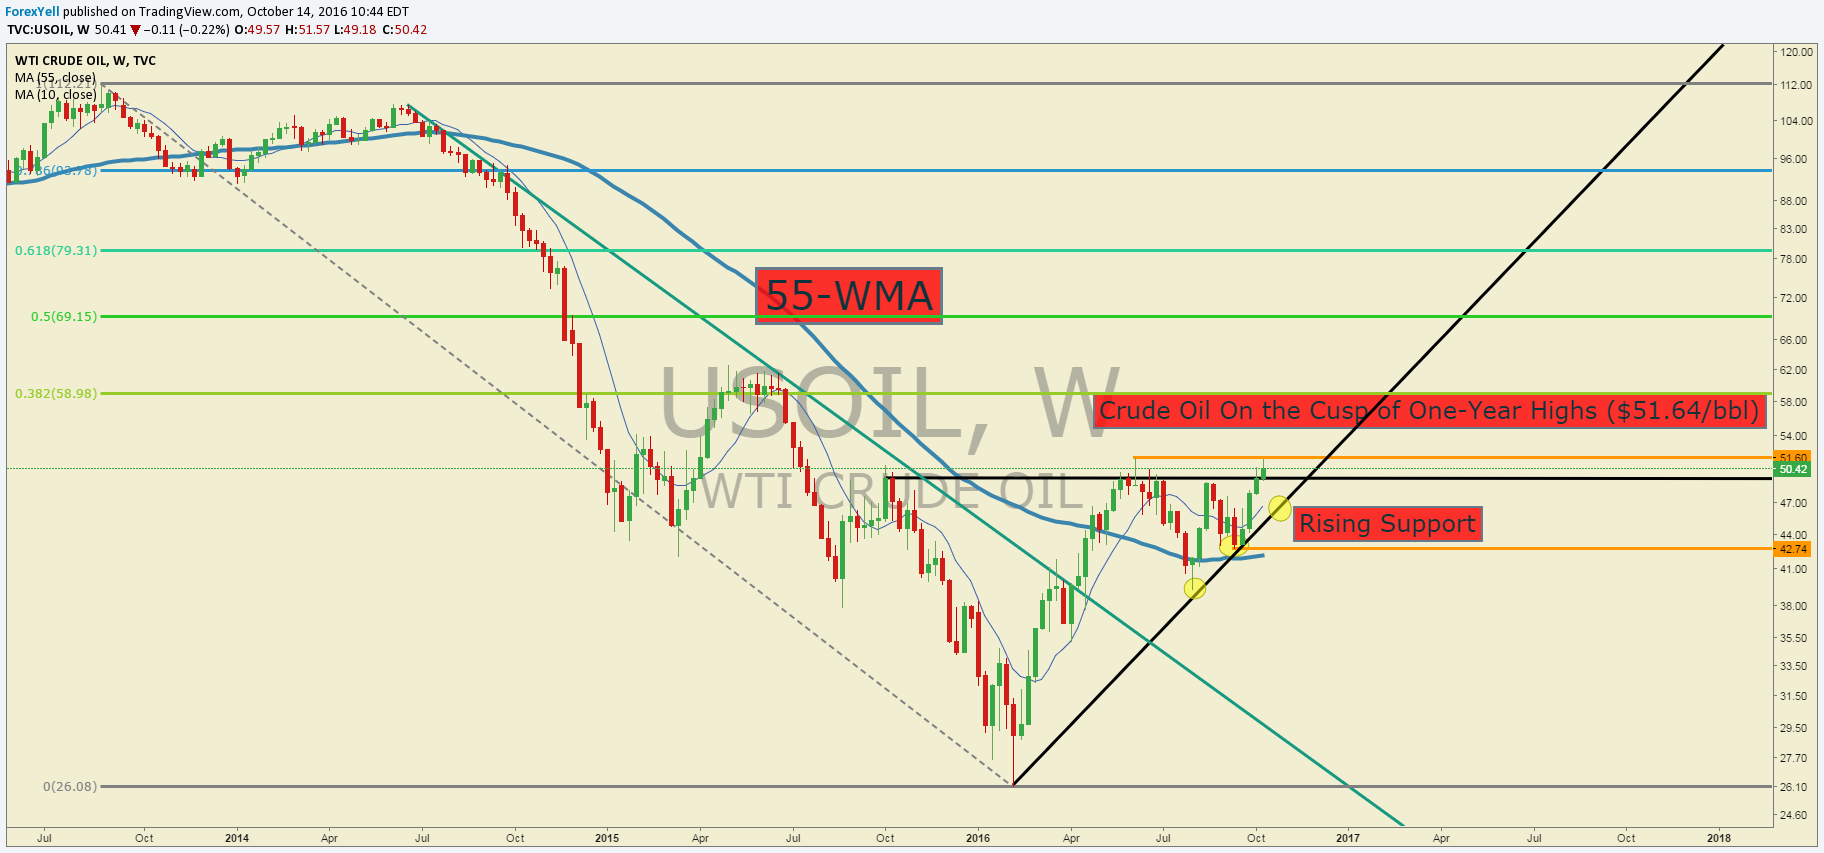
Chart Created by Tyler Yell, CMT. Courtesy of TradingView
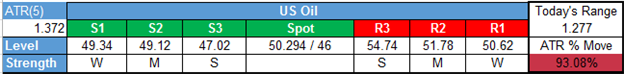
Short-Term Crude Oil Price Support & Resistance Levels:
(Click on image to enlarge)
Subscribe to Jamie Saettele's distribution list in order to receive a free ...
more

