
Oil Market Update
In the last Oil Market update posted on the 2nd it was pointed out that while oil looked like it had further to run short-term, its COTs, Hedgers positions and sentiment indicators were already at wild extremes suggesting that a top was looming, and now, after targets were hit yesterday, it looks like an intermediate top may, at last, be in – perhaps it was the sight of that large oil tanker burning off the coast of China that gave it the final push.
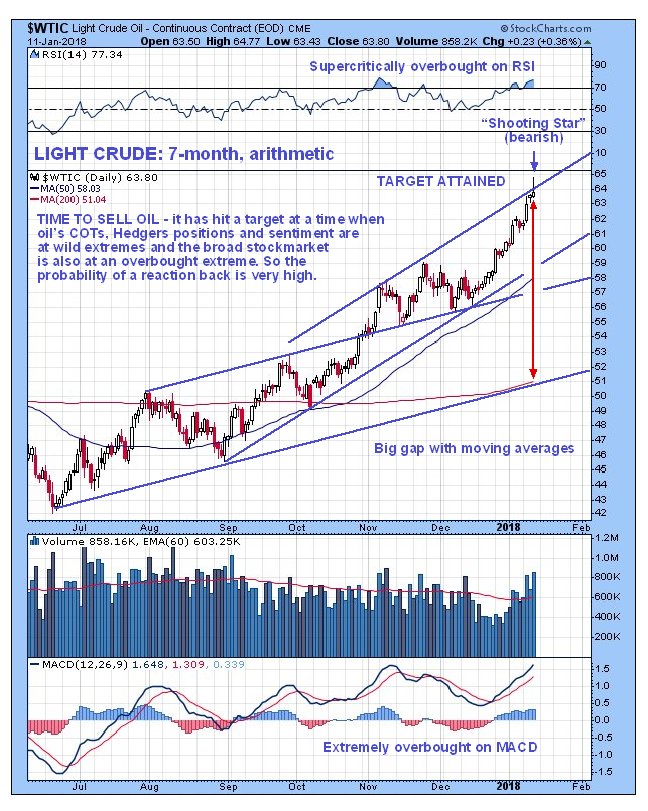
On the Light Crude 7-month arithmetic chart we have a fit for oil hitting a target yesterday at the top of a parallel channel where a bearish “Shooting Star” candlestick appeared on the heaviest volume for nearly 2 months, having opened up a big gap with its moving averages and with oscillators at extremes. All of this suggests that it may have hit a significant top here. Note that a 7-month time period for this chart was selected to show the June trough.
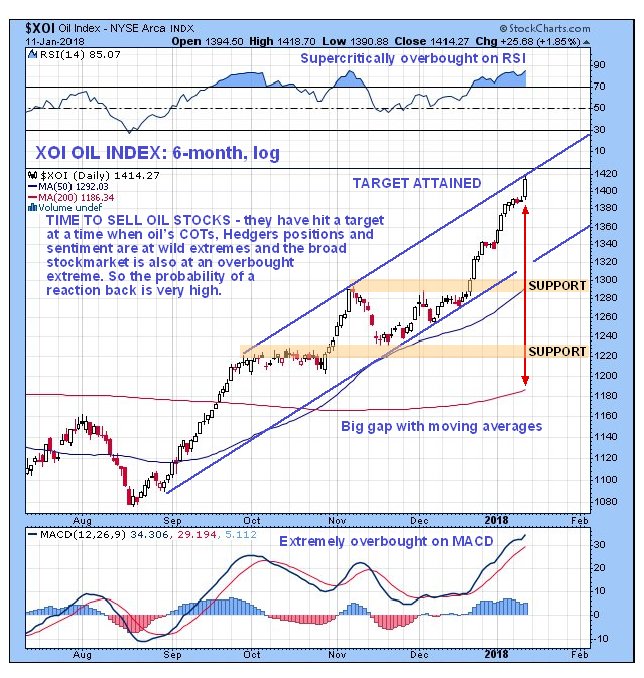
Oil stocks likewise hit a parallel trendline target yesterday, although this was on a log chart. On the 6-month chart for the XOI oil index, we can see that it hit this target with its RSI indicator supercritically overbought and its MACD indicator extremely overbought, having opened up a very large gap with its moving averages.
The push to even higher highs by both oil and oil stocks has occurred against the background of wild extremes in COTs, Hedgers positions, and sentiment indicators.
Last week’s oil COT was showing very high Large Spec long positions, which will have increased to even higher levels this week. Note that this chart will be updated tomorrow…
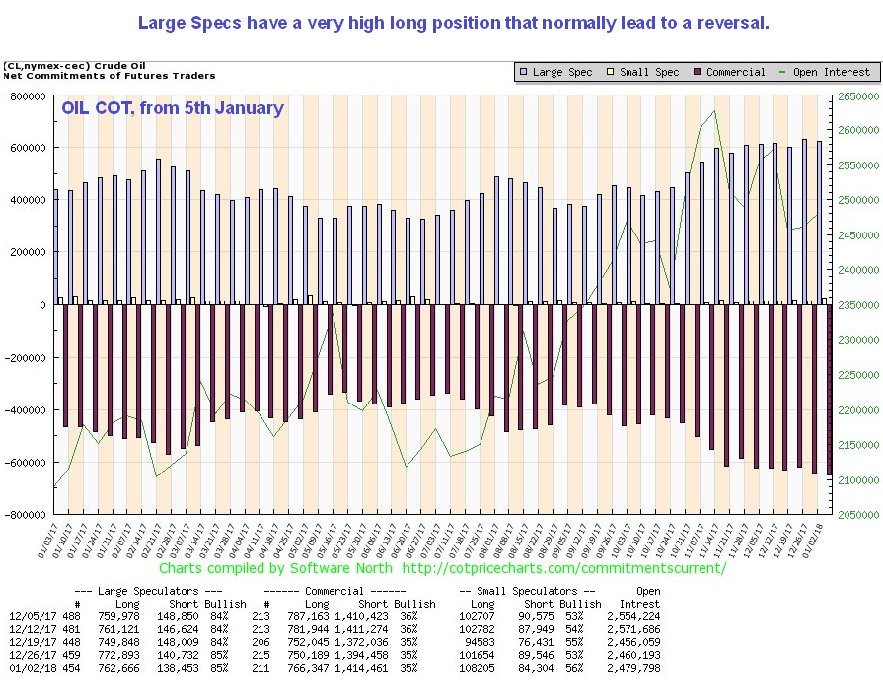
Click on chart to popup a larger clearer version.
Hedgers’ positions are at wild record extremes that ordinarily call for a significant reversal now or soon…
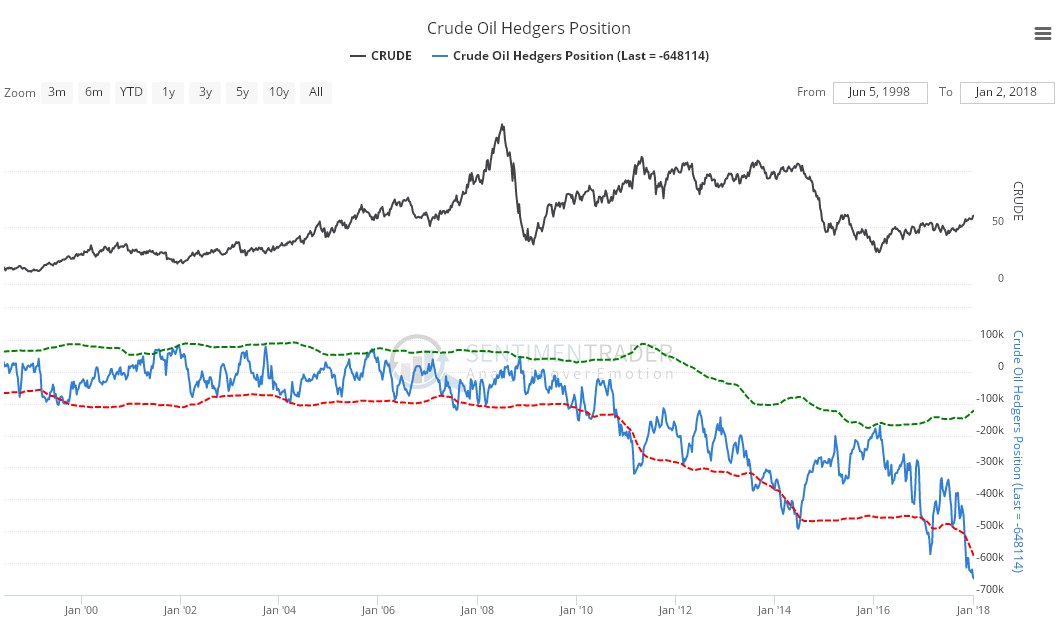
Click on chart to popup a larger clearer version.
Chart courtesy of sentimentrader.com
It’s the same with sentiment. The latest Oil Optix, or optimism index is very close to its most extreme readings ever, that usually lead to a reversal and big drop, as can be seen on the latest chart below…
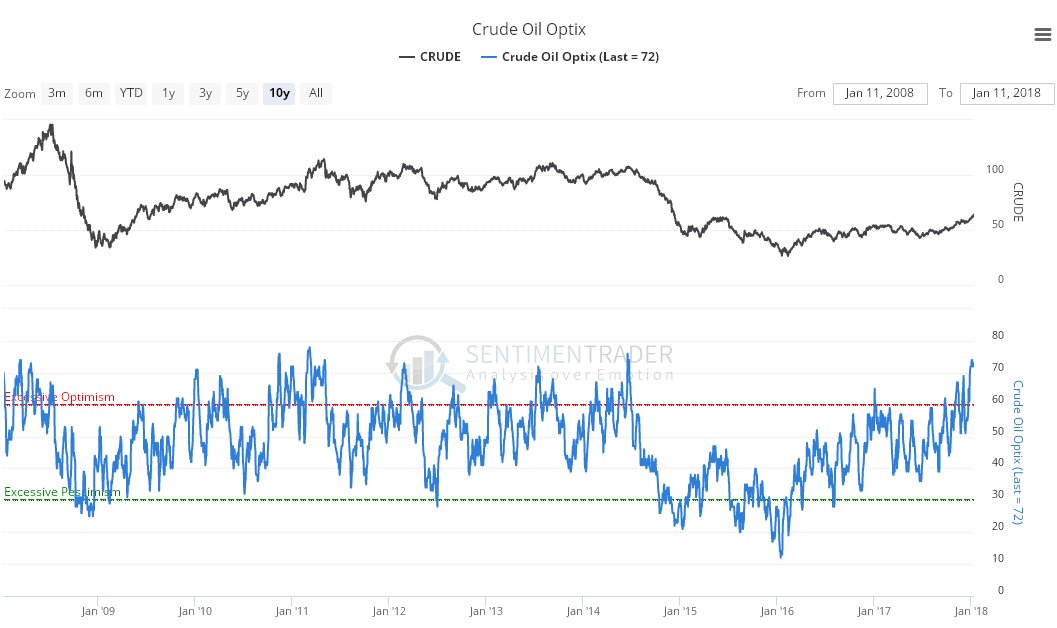
Click on chart to popup a larger clearer version.
Chart courtesy of sentimentrader.com
The conclusion to all this is that it makes sense to exit most all oil investments here. Whilst we cannot rule out that oil will continue higher, the odds are now heavily stacked against it.
Note that the COT and Hedgers charts presented here will be updated tomorrow after the latest ones become available.
End of update.


