
October’s Selloff Was Panicky – Or Not – Depending On What Metrics One Looks At
One of the knocks against October’s selloff in stocks is that there was no capitulation. That depends on what indicators one looks at.
On October 10, the ratio between NYSE decliners and advancers read 7.9. In that same session, down volume was 9.8 times to that of up, followed by a reading of 4.9 in the following session. Then on the 24th, the down-up ratio again registered 6.9. These are high readings, if not outright panicky.
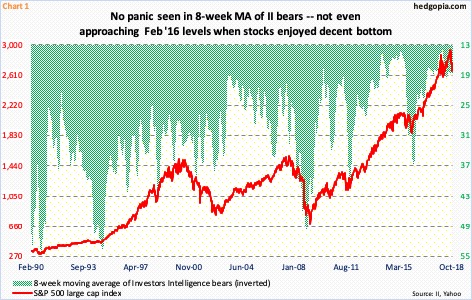
On the other hand, some of the other sentiment readings were not nearly as rattled. This week, Investors Intelligence bears rose a tad to 19.8 percent, bulls were 44 percent. For comparison purposes, in February 2016 when US stocks reached a major bottom, bears rose as high as 39.8 percent. Consequently, the eight-week moving average currently stands at 18.6 percent, as opposed to 36.8 percent in early March 2016 (Chart 1).
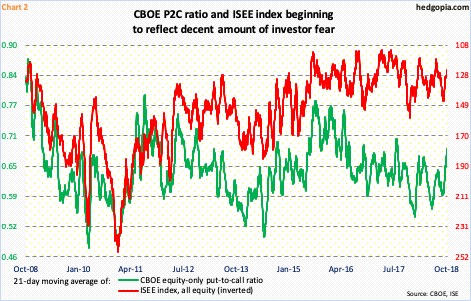
The situation is different in the options market. Chart 2 calculates a 21-day moving average of the CBOE equity-only put-to-call ratio and the ISEE index. The latter is a call-to-put ratio, hence inverted. Both reflected a rise in investor fear during the recent selloff.
Stocks peaked early October. In all of last month, there were three sessions in which the CBOE put-to-call ratio printed 0.80s – October 5th, 19th and 26th. The 21-day average rose from 0.588 on September 25 to Wednesday’s 0.684 – the highest since August 2017. In the past, readings of high 0.60s to low 0.70s consistently marked a bottom in stocks – duration and magnitude notwithstanding.
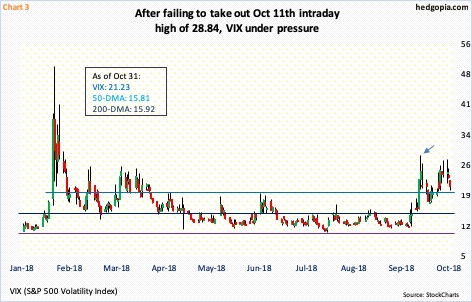
During the selloff, volatility never rose to a panicky level. On October 11, VIX jumped to 28.84 intraday, before ending with a candle with a long shadow (arrow in Chart 3). Since that date, major equity indices proceeded to make new lows, even as VIX could never surpass that high. How VIX behaved last month was so much different from how it behaved in February this year. Back then, the volatility curve was in insane backwardation. Once again, the curve is in backwardation, which reflects the amount of premium demanded for protection near term.
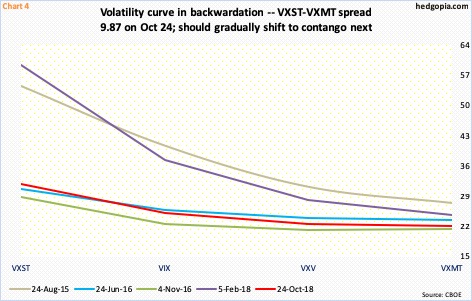
VIX measures the implied volatility of S&P 500 index options over the next 30-day period. The other three measures of volatility achieve the same goal but for different time periods – VXST for nine days, VXV for three months, and VXMT for six months.
Chart 4 lays out the curve for five different time periods, in which the VXST-VXMT spread is seven or above. On the 24th last month, it was 9.87. In August 2015 and February this year, the spread was in the 20s and 30s, which was more of an exception than a rule. The prevailing spread is wide enough it needs to get unwound. In due course, backwardation will give way to contango. When that happens, shorter-term volatility will drop faster than its longer-term brethren. Risk-off will give way to risk-on. This bodes well for stocks.
In the aggregate, during October’s mini-rout in stocks, some metrics looked panicky, some others less so, and still others not at all. What this probably suggests is that last week’s lows, when it is all said and done, come with enough of a tailwind to unwind oversold conditions, including weekly, but likely not enough to be at the same level as what was seen in February 2016.
Disclaimer: This article is not intended to be, nor shall it be construed as, investment advice. Neither the information nor any opinion expressed here constitutes an offer to buy or sell any ...
more

