
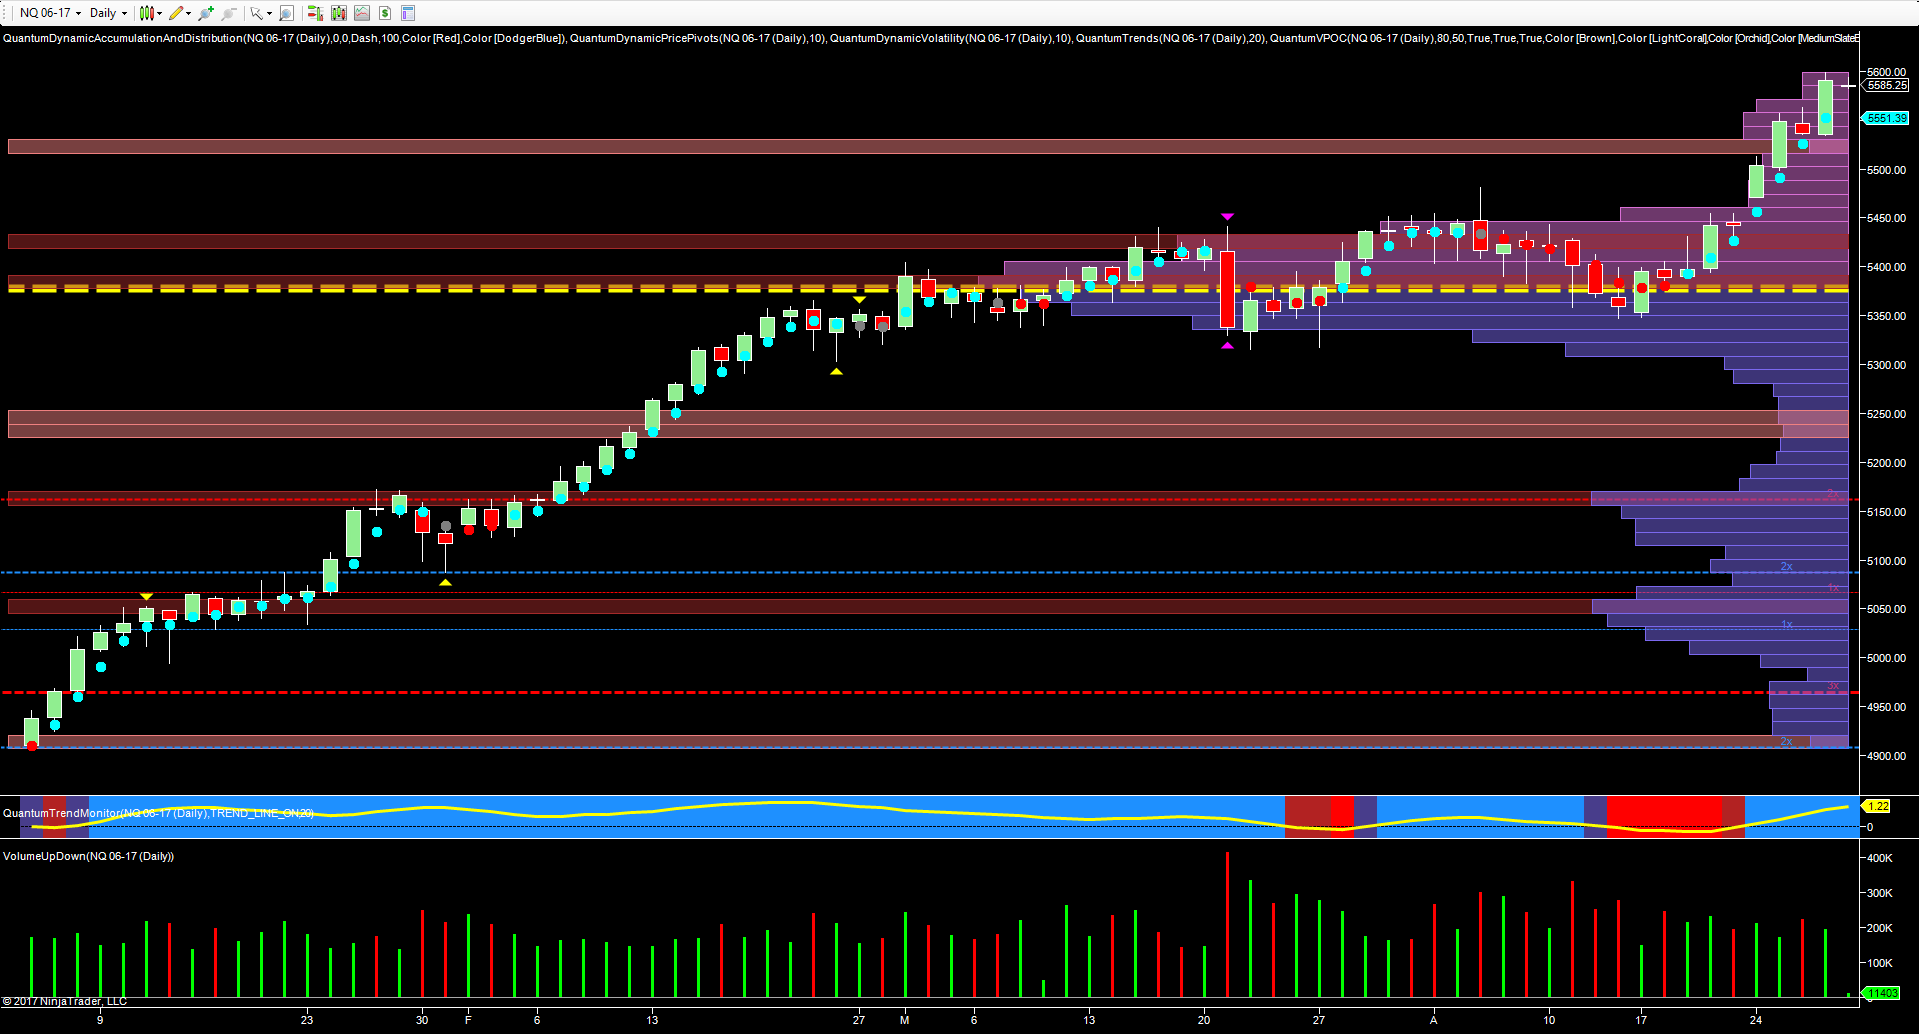
NQ E-mini Leading The Way Once Again
(Click on image to enlarge)
For those students of the market who are widely read, the words of Jesse Livermore are never more apposite than at present, and I am reminded of his quote which is simply this: ‘no market is ever too high to buy or too low to sell’. As the NQ e-mini continues its remorseless rise ever higher, the usual crop of analysts and experts are emerging to suggest this market is completely disconnected from everyday reality (which it probably is) and bears no relationship to the economic picture. And the corollary to this is that the big short is just around the corner. Well I have to disappoint, but this is not the case, and for confirmation and evidence of this we need look no further than the relationship between volume and price, and as any student of Wyckoff will know, the precursor to the bear market will be some climactic price action as the selling climax develops, prior to any major reversal. This will be coupled with a dramatic rise in volume, with the price action reflecting volatility, driven by news events and leveraged by the market makers accordingly. To date, this has not yet appeared.
This week’s price action has been significant, with the NQ Emini once again leading the US markets higher and breaking into ever higher new ground and moving strongly away from the congestion phase which saw the index oscillate around the volume point of control in the 5370 area. The solid trend higher supported by average volume confirms the bullish sentiment with the index rising quickly through the low volume node at 5510 and closing yesterday’s price action with a wide spread up candle and testing the 5600 region. What is particularly interesting at present is that fact that the NQ is once again the leader of the pack, with both the YM e-mini and the ES e-mini yet to break out into new high ground on their equivalent daily charts. Indeed whilst the price action for the NQ has been very bullish, the YM e-mini, and to a lesser extent the ES e-mini have been mildly bearish and moving into short-term congestion phases.
(Click on image to enlarge)
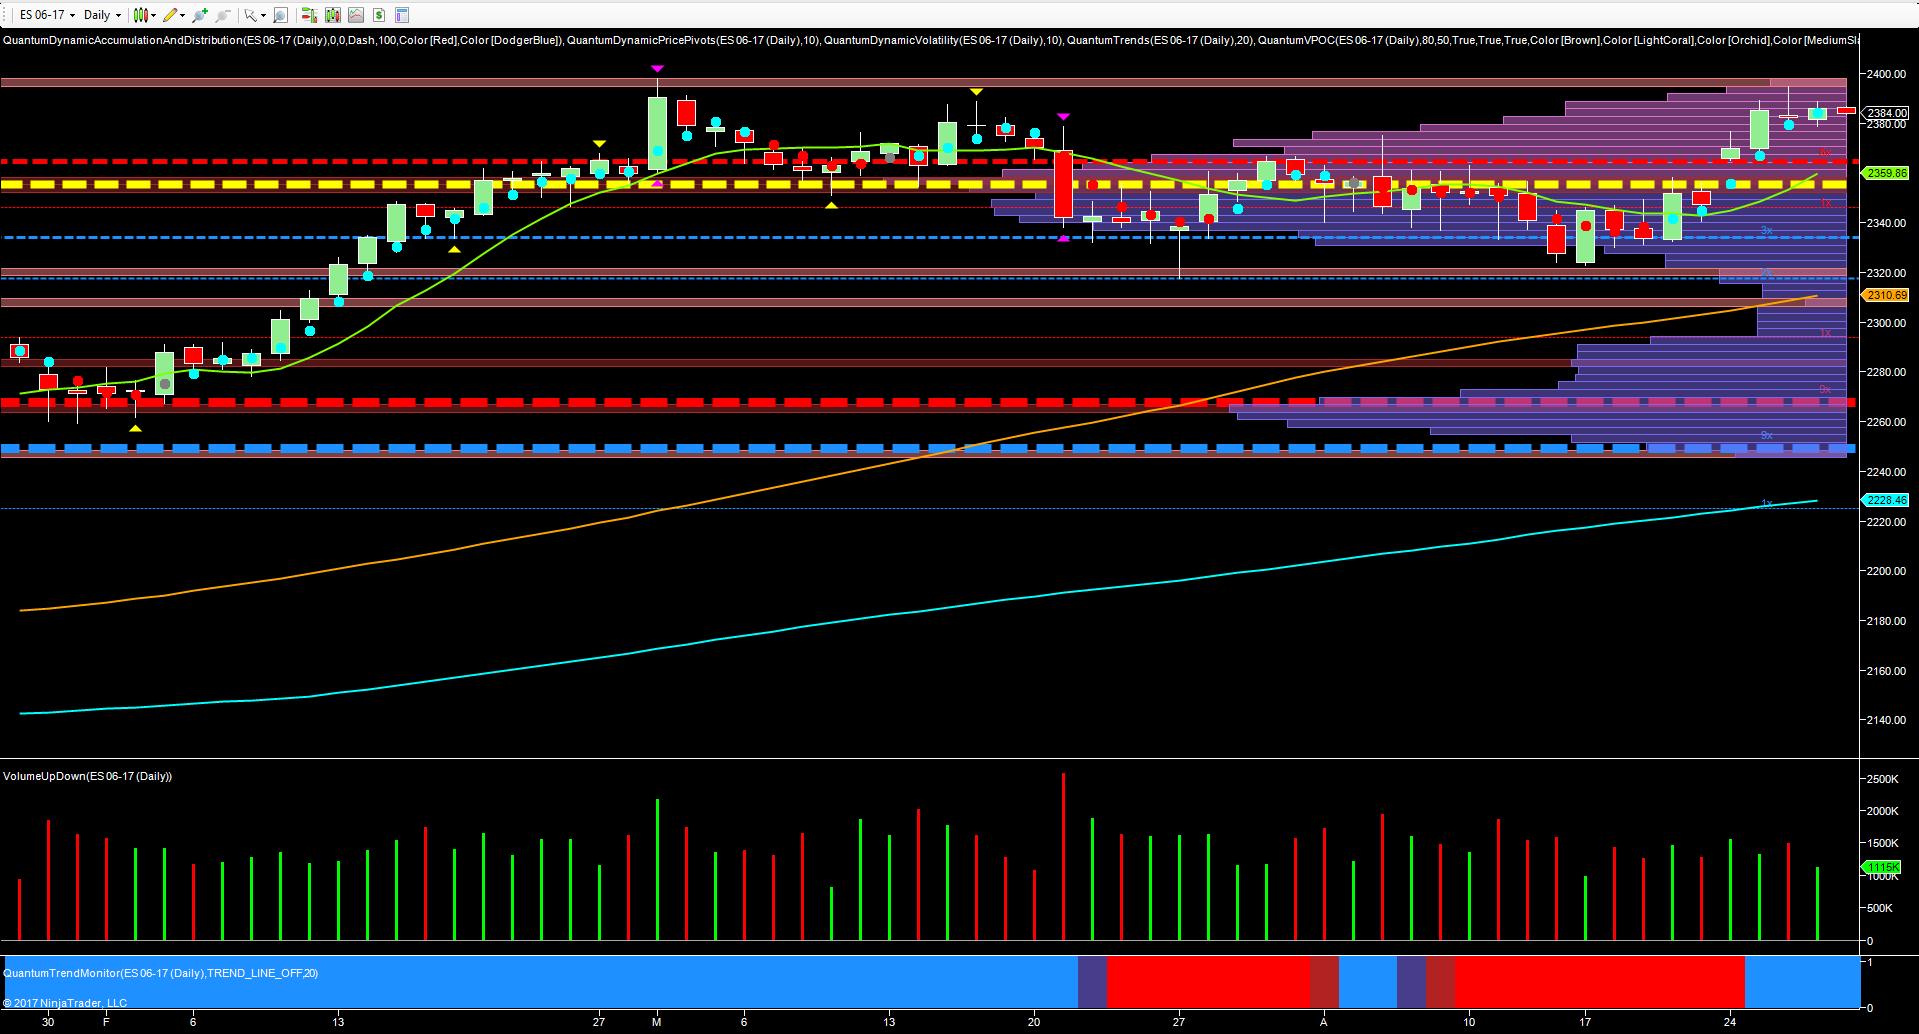
Moving to the daily chart for the ES e-mini, the key level here is in the 2400 area, with any move through this level then confirm ing the bullish sentiment signaled on the NQ e-mini, with the volume point of control anchored firmly below in the 2345 area.
(Click on image to enlarge)
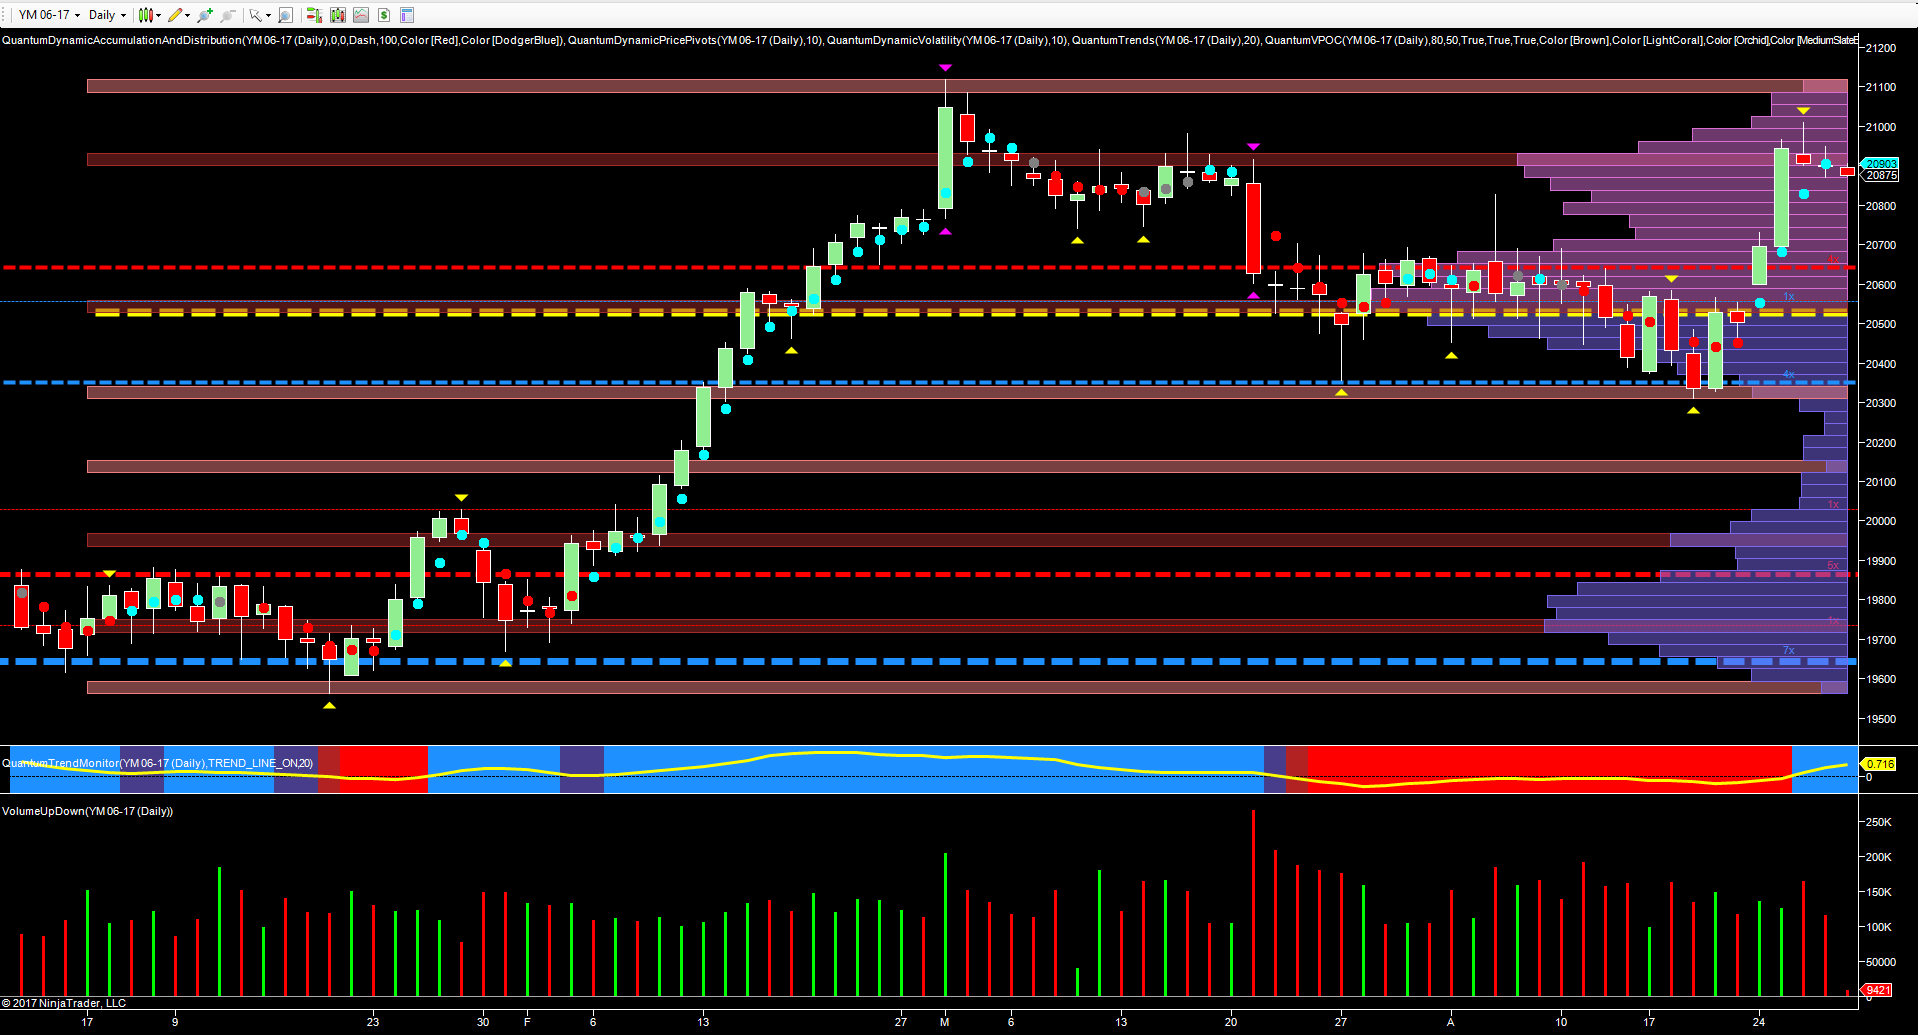
This picture is also mirrored on the YM e-mini daily chart, with the 21113 high of the 1st March setting the level here.
(Click on image to enlarge)
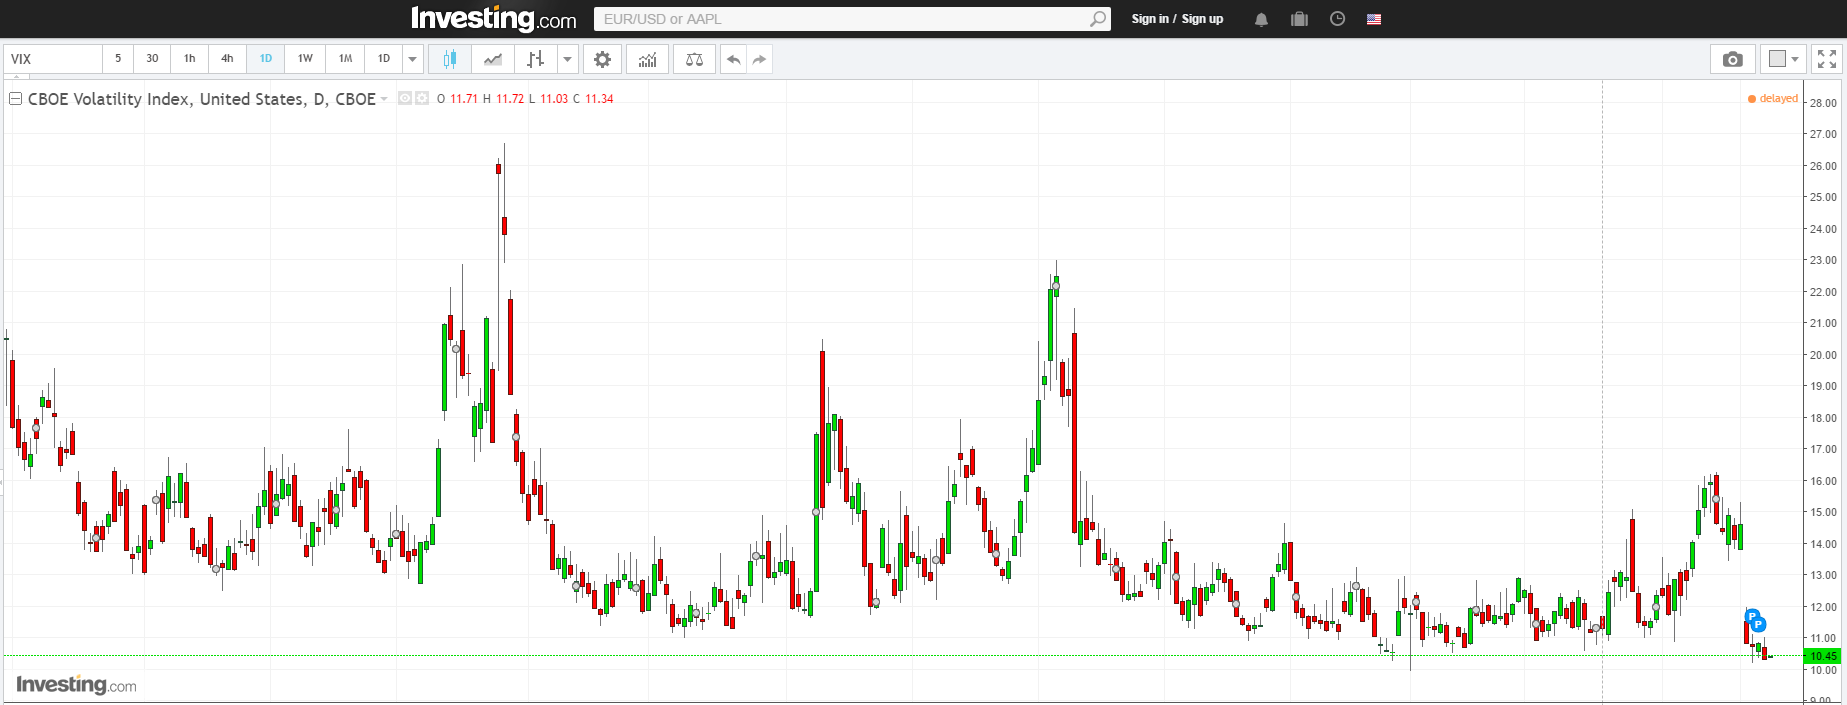
And no analysis would be complete without a check on the VIX which is once again approaching the floor of support in the 10.50 area, and with the potential to finally break through and move into single figures. Any such move will then signal further bullish momentum, but of course, as complacency develops, the prospect for the big short then increases.
However, as always, it is no surprise to see the NQ e-mini leading the way, given the US economy is now developing an early expansion phase of economic growth, with the technology sector likely to perform well in this period. So remember the wise words of Jesse, and assuming some cataclysmic event does not overwhelm the market, such as Donald Trump’s Twitter account being hacked, the outlook for US equities continues to remain bullish for the time being, with the big short on hold for now.
Disclaimer: Futures, stocks, and spot currency trading have large potential rewards, but also large potential risk. You must be aware of the risks and be willing to accept them in order to invest in ...
more

