
New Year Commences With A Bullish Optimism, But Will It Last?
Investors continue to be sanguine about the economy and are reluctant to lighten up on stocks, even as we enter the New Year on the heels of a big post-election run-up, perhaps for fear of missing out on continued upside. Rather than fearing the uncertainty of a new (and maverick) administration, they instead have an expectation of a more business-friendly environment, fiscal stimulus, and a desirably higher level of inflation under Trump and a Republican-controlled congress. Stimulus likely would include lower corporate and personal taxes, immediate expensing of capital investment (rather than depreciating over time), incentives to repatriate offshore-held cash, reduced regulatory burdens, and infrastructure spending programs. Longer term, we also might see more favorable international trade deals and a freer market for healthcare coverage. Even the Fed is finally admitting that monetary stimulus alone can’t do the trick.
As the New Year gets underway, the technical picture remains strong, as the Dow is gathering strength to challenge ominous psychological round-number resistance at 20,000 and market breadth is impressive, led by small caps and value stocks. I believe we have a favorable environment for US equities going forward – especially fundamentals-based portfolios, like Sabrient’s annual Baker’s Dozen.
In this periodic update, I give my view of the current market environment, offer a technical analysis of the S&P 500 chart, review Sabrient’s weekly fundamentals-based SectorCast rankings of the ten U.S. business sectors, and then offer up some actionable ETF trading ideas. Overall, our sector rankings still look bullish, and the sector rotation model continues to suggest a bullish stance.
Market overview:
Investors now seem willing to ignore the news headlines that were so distracting for so long and instead focus on the many positive fundamentals. Starting in summer 2015 until mid-February 2016, fundamentals simply didn’t matter as election campaign rhetoric and news about China growth and currency, Fed monetary policy, and oil prices were all the mattered each day. Market leadership was narrow and dominated by a handful of mega cap favorites (e.g., “FANG”). Then, in mid-February 2016, the markets reversed to the upside, led at first by the normal oversold short-covering before broadening to include fundamentally solid companies with attractive valuations. This broadening continued throughout the year, with brief speed bumps caused by things like the Brexit vote, heinous terrorist attacks, and the lead-up to the presidential election, among others. The combination of the election result and higher oil prices led to outperformance by year end in Energy and Financial stocks. Now, as the New Year commences, we continue to witness healthy market breadth and diverse leadership from economically sensitive sectors, and particularly from value and small cap stocks.
Impressively, the global market for exchange-traded products (ETPs, which includes ETFs and ETNs) had another banner year, achieving another new record high. First Trust Advisors was the big winner in net inflows with over $3 billion, according to ETFGI. The top performing non-leveraged ETFs of 2016 include PureFunds Junior Silver Miners (SILJ) at +150%, and VanEck Vectors Russia Small-Cap ETF (RSXJ) at +105%.
I was telling advisors since the beginning of 2016 that I expected a double-digit gain for the S&P 500 by the end of the year. As you recall, the S&P 500 index began the year with its worst January performance in history (-10.5%) after China devalued its currency and slapped controls on its stock market, leading to fears of a hard landing. So things weren’t looking so good (re: “January effect”) when I was talking about double-digit gains. But I knew that fundamentals were solid, there was no recession in sight, and the only thing apparently holding back stock prices was fear of the unknown. The S&P 500 ended up the year with a gain of +9.5% (price index), even after giving back nearly 2% in the last two weeks of the year. Including dividends, its total return was nearly +12%. The Dow Industrial Average finished up +13.4%, with Goldman Sachs (GS) contributing the most to this price-weighted index, while Nike (NKE) hurt it the most. Nasdaq was up a respectable +7.5%. But most encouragingly, small caps were particularly strong with the Russell 2000 up +19.7% and the S&P 600 up +24.7%. Notably, all the small cap outperformance came after the presidential election.
Although MSCI emerging markets price index was up for the year by +8.1% (+10.9% total return), it is notable that ever since the election it has diverged from US equities, likely due to the expected negative impact of rising interest rates and a strengthening dollar on emerging market countries that carry dollar-denominated debt. Moreover, during the past decade, the average annual total return of the S&P 500 index was +6.87%/yr while the MSCI Emerging Markets index was +1.09%/yr. Thus, some say that global markets are destined to outperform after such a lengthy period of underperformance – due to mean reversion, if nothing else.
Brazil had a strong recovery year, with its stock market the biggest gainer on the global stage rising +69% as measured in US dollars. Worst performing was China at -18% in USD. Natural gas and crude oil were particularly strong, with oil closing the year at $55 – a “Goldilocks” level that is high enough for the industry to earn profit and justify capital investments but still low enough for consumers to tolerate prices at the pump. Gold finished at +8% and silver +16%. The US dollar rose +20% vs. Mexico peso, +3.3% vs. euro, and +6.9% vs. China yuan, but fell -15.2% vs. Russia ruble and -17.8% vs. Brazil real.
Value continues to outperform Growth, at least partly because a rising discount rate lessens the present value of growth stocks’ future earnings, making their relatively high P/Es less justifiable. While the S&P 500 was up +9.5% in 2016, S&P 500 Value was +14.5% versus S&P 500 Growth at +5.2%. Looking at the sectors within the S&P 500, Energy was the top performer for 2016 at +24.9%, followed by Financial at +20.1% (+16.3% just since the November 8 election), Industrial +17.4%, Basic Materials +14.5%, Technology +12.9%, and Utilities +12.2%. Healthcare was the worst at -4.3%, as it simply couldn’t shake headline and regulatory risk, followed by newcomer Real Estate at -1.4%. Consumer Staples and Consumer Discretionary were also laggards at +2.4% and +4.1%, respectively. Not surprisingly, Energy was also the most volatile sector. Among the S&P 400 mid caps and S&P 600 small caps, Basic Materials was the top performing sector.
The CBOE Market Volatility Index (VIX), aka fear gauge, closed the year at 14.04, although it closed as low as 11.27 back on December 21. After spiking to as high as 23 in advance of the November 8 election, it fell immediately thereafter and has remained securely below the 15 threshold between complacency and fear ever since.
With the election behind, market participants were able to focus on the solid economic fundamentals and the prospect of fiscal stimulus and regulatory reform. As a result, we have seen a marked boost to Sabrient’s portfolios, which are based on our numbers-driven, fundamentals-based, forward-looking growth-at-reasonable-price (GARP) quant model. This was partly due to the shift from a news-driven cloud of uncertainty and risk-on/risk-off behavior to fundamentals-driven trading and valuations, but also to the many solid valuations in neglected market segments getting their overdue attention – such as the airlines, which scored quite well in our system last January. Note that the US Global Jets ETF (JETS) was up +11.8% in 2016, even though it was down nearly -5% in advance of the election before taking off on a big multi-week rally.
The 10-year Treasury closed 2016 at 2.45% after starting the year at 2.27% and falling to as low as 1.37% in early July. After the election, it reached as high as 2.60% in mid-December, so yields have finally pulled back a bit after their rapid post-election rise. The 30-year closed 2016 at 3.06% (high of 3.18% in mid-December). On the short end of the yield curve, the 2-year climbed to 1.19% (high of 1.27% in mid-December) by year end, and the 5-year was at 1.93% (high of 2.07% in mid-December). The spread between the 10-year and 2-year is 126 bps, while the spread between the 30-year and 5-year is 113 bps. While some think we finally are seeing the long-anticipated “Great Rotation” from bonds into stocks, others think bonds simply needed to reach a yield that would attract income investors. Perhaps they are getting to such a level. If yields do stabilize, it also would keep the dollar from surging too strongly. Similarly, high-quality stocks paying a solid dividend yield should once again attract buyers in 2017.
CME fed funds futures place the odds of the next rate hike to occur in February at only 4%, but it rises to 25% by March, 38% in May, and 67% in June (plus a 20% probability of two rate hikes by then). Nevertheless, rates remain low by historical standards, and we still have an accommodative Fed.
Notably, Fed governors have been giving speeches indicating a need for complementary stimulus to their monetary policies – in other words, they are admitting that their limited monetary policy tools are not sufficient by themselves. They have spoken of the power of fiscal policy to enhance productivity and speed economic growth, calling for investment in public infrastructure and education, extending unemployment benefits, cutting the payroll tax, loosening obstructive regulation, and creating incentives for private investment – all to “take some pressure off” the Fed.
For many years, the US long enjoyed an average annual GDP growth rate of 3.3%, and yet despite the Fed’s best efforts, we haven’t seen even one year of 3% growth since 2005, marking an 11-year stretch that is the longest in modern history. In fact, the economy weakened in 2015 and 2016 compared with 2013 and 2014. I have long argued that our nearly 8-year reliance on the Fed’s monetary policies of ZIRP and QE has done no more than prop up a stagnant economy at the expense of an ever-widening wealth gap – that is, those who already own assets are doing quite well while the large majority who aspire to higher wages and asset ownership are finding it increasingly difficult. This festering sore has inevitably spawned widespread discontent, class warfare, and a powerful populist movement, leading to unforeseen results like Brexit, the amazing popularity of a quirky old Vermont senator who espouses “democratic socialism,” and the election of a political outsider as our president on a platform based on slogans like “Drain the Swamp” and “Make America Great Again.”
Many people who have depended upon welfare as a way of life – sometimes over multiple generations with little hope of ever breaking the cycle of poverty – seem ready to try a new direction. Indeed, they are realizing that economic growth creates more opportunities leading to broader prosperity, which is a far better way of curing societal ills than social engineering and forced wealth redistribution. There was once a time and place in our history that needed such government intervention, but that is not our world today, in my view. We live in a highly competitive global economy, so rather than attempting to legislate fairness and inclusion on a reluctant populace, the better approach is to unleash the marketplace and entrepreneurism so as to encourage such behavior by economic necessity.
I think the outlook is quite good. Consumer Confidence recently hit 113.7, which is its best report since 2001. ISM Manufacturing clocked in at 54.7, and the New Orders component hit an impressive 60.2. Global Manufacturing PMI increased to 52.7. The Q4 GDPNow estimate bumped up to +2.9% from the previous +2.5%. Although there may be some trimming of sell-side EPS estimates for multinationals in 2017 due to the strong dollar, the upcoming Q4 earnings reports are likely to be strong.
In fact, the most immediate catalyst for a continuation of the market rally is not so much what changes Trump can quickly implement but rather corporate earnings growth, led by top-line (revenue) growth. This has already been underway during the second half of 2016, but a boost in capital expenditures will be key to continuing the trend. Despite historically low interest rates, spending on new equipment virtually collapsed last year, with the oil industry being the poster child for slashed spending. Certainly, a cut to corporate income tax rates would help boost CapEx. And if infrastructure spending eventually materializes, it can provide a long-term source of demand for new equipment from companies in Technology and Industrial sectors. Also, given the promise of regulatory reform, the great outperformance in small caps since the election may be signaling an impending surge in new business formations in 2017, which would also reverse a downward trend. Indeed, I think small caps are poised to lead a continued rally, especially since they are less impacted by rising borrowing rates and a strong dollar.
Yes, there appears to be a lot of reason for optimism in the economy, corporate earnings, and equities – next year and into 2018. And hedge funds seem to agree, as BAML reported that during Q4 the $3 trillion hedge fund industry increased its net equity exposure to 63%.
Here at Sabrient, founder and chief market strategist David Brown and his research team, which includes the forensic accounting expertise of wholly-owned subsidiary Gradient Analytics, are currently working through the final selection process for our ninth annual Baker’s Dozen top stocks list for 2017, which will be unveiled on January 17. I and some of my colleagues will be spending a good bit of time on the road over the next several weeks traveling with our partners at First Trust and speaking with financial advisors across the country on this topic.
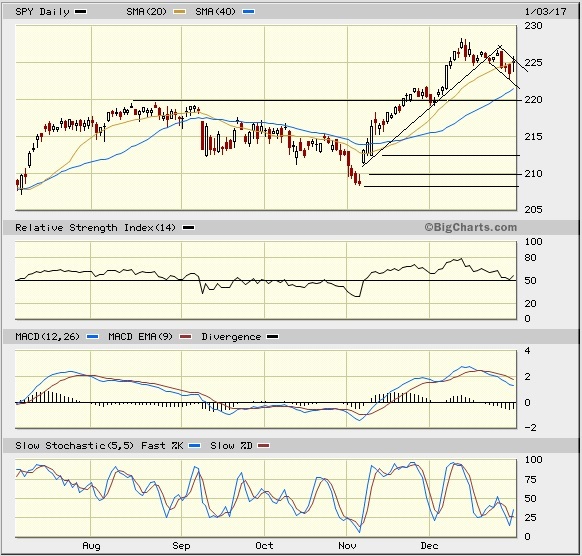
SPY chart review:
The SPY closed 2016 at 223.53 after giving up nearly 2% of its huge post-election gains in the last several trading days. As shown on the chart, I think SPY might be in the midst of forming a bull flag continuation pattern. This week, it has been testing support at the 20-day simple moving average. Next support below that is the 50-day SMA (and earlier resistance-turned-support) at the 220 level, followed by the 100-day at 218, and the 200-day down around 214 – but all these moving averages are rising, which is encouraging. Oscillators RSI, MACD, and Slow Stochastic have all cycled back down and look ready to move higher. A run-up into inauguration day is not out of the question, but I think bulls might prefer to do some more testing of conviction before they are ready for a clean breakout (especially of Dow 20,000). If you look at a chart of the Dow blue chips and the Russell 2000 small caps, they are similarly testing support at the 20-day SMA, but rather than a bull flag pattern, both appear to be in a sideways channel, awaiting an upside breakout catalyst. Overall, I continue to like the technical picture, particularly given the excellent market breadth and the impressive strength of small caps and value stocks.
Latest sector rankings:
Relative sector rankings are based on our proprietary SectorCast model, which builds a composite profile of each of over 600 equity ETFs based on bottom-up aggregate scoring of the constituent stocks. The Outlook Score employs a forward-looking, fundamentals-based multifactor algorithm considering forward valuation, historical and projected earnings growth, the dynamics of Wall Street analysts’ consensus earnings estimates and recent revisions (up or down), quality and sustainability of reported earnings (forensic accounting), and various return ratios. It helps us predict relative performance over the next 1-3 months.
In addition, SectorCast computes a Bull Score and Bear Score for each ETF based on recent price behavior of the constituent stocks on particularly strong and weak market days. High Bull score indicates that stocks within the ETF recently have tended toward relative outperformance when the market is strong, while a high Bear score indicates that stocks within the ETF have tended to hold up relatively well (i.e., safe havens) when the market is weak.
Outlook score is forward-looking while Bull and Bear are backward-looking. As a group, these three scores can be helpful for positioning a portfolio for a given set of anticipated market conditions. Of course, each ETF holds a unique portfolio of stocks and position weights, so the sectors represented will score differently depending upon which set of ETFs is used. We use the iShares that represent the ten major U.S. business sectors: Financial (IYF), Technology (IYW), Industrial (IYJ), Healthcare (IYH), Consumer Goods (IYK), Consumer Services (IYC), Energy (IYE), Basic Materials (IYM), Telecommunications (IYZ), and Utilities (IDU). Whereas the Select Sector SPDRs only contain stocks from the S&P 500, I prefer the iShares for their larger universe and broader diversity.
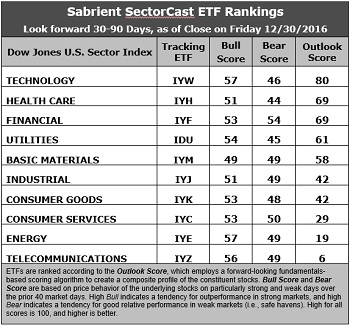
Here are some of my observations on this week’s scores:
1.Technology retains the top spot with a score of 80. In aggregate, stocks within the sector display relatively solid Wall Street sell-side analyst sentiment, strong return ratios, a reasonable forward P/E of about 16.5x, a high forward long-term EPS growth rate of 13.9%/yr, and the lowest forward PEG of 1.2 (ratio of forward P/E to forward EPS growth rate). Healthcare and Financial tie for second this week with an Outlook score of 69. Healthcare displays the lowest forward P/E of 15.0x, a solid forward long-term EPS growth rate of 10.8%, a forward PEG of 1.4, and decent return ratios. Financial has the best sentiment among both Wall Street analysts and insiders, and a reasonable forward P/E of 16.7x. Rounding out the top five (all with Outlook scores above 50) are Utilities and Basic Materials.
2.Telecom and Energy again take the bottom two with Outlook scores of 6 and 19. Telecom displays weak insider and analyst sentiment (net negative earnings revisions) and an elevated forward P/E (28.3x) and forward PEG (3.4). Energy has the highest forward P/E (32.5x) and a high forward PEG (3.3), as well as low return ratios and weakening year-over-year EPS growth comps – although the sector also displays the best sell-side sentiment (net positive earnings revisions). Although Energy stocks in aggregate appear relatively overvalued, Sabrient has found pockets of attractive valuations among some companies in the space.
3.Looking at the Bull scores, Technology and Energy share the top score of 57 as they have displayed relative strength on strong market days, while Basic Materials is the lowest at 49. The top-bottom spread is only 8 points, which reflects high sector correlations on strong market days, which is not as favorable for stock picking. It is desirable in a healthy market to see low correlations reflected in a top-bottom spread of at least 20 points, which indicates that investors have clear preferences in the market segments and stocks they want to hold (rather than broad risk-on behavior).
4.Looking at the Bear scores, we find Financial at the top with a score of 54, which means that stocks within the sector have been the preferred safe havens lately on weak market days. Healthcare scores the lowest at 44, as investors have fled during market weakness. The top-bottom spread is only 10 points, which reflects high sector correlations on weak market days. Ideally, certain sectors will hold up relatively well while others are selling off (rather than broad risk-off behavior), so it is desirable in a healthy market to see low correlations reflected in a top-bottom spread of at least 20 points.
5. Technology displays the best all-around combination of Outlook/Bull/Bear scores, followed by Financial, while Telecom is the worst. However, looking at just the Bull/Bear combination, Financial is the best, followed by Energy, indicating superior relative performance (on average) in extreme market conditions (whether bullish or bearish), while Healthcare is the worst. Given the underperformance of Healthcare, this is not surprising.
6.This week’s fundamentals-based Outlook rankings still look slightly bullish to me, given that the top of the rankings comprises mostly economically-sensitive sectors, including Technology, Financial, and Basic Materials. Keep in mind, the Outlook Rank does not include timing, momentum, or relative strength factors, but rather reflects the consensus fundamental expectations at a given point in time for individual stocks, aggregated by sector.
ETF Trading Ideas:
Our Sector Rotation model, which appropriately weights Outlook, Bull, and Bear scores in accordance with the overall market’s prevailing trend (bullish, neutral, or defensive), still displays a bullish bias and suggests holding Technology (IYW), Energy (IYE), and Utilities (IDU), in that order. (Note: In this model, we consider the bias to be bullish from a rules-based trend-following standpoint when SPY is above both its 50-day and 200-day simple moving averages on the rebalance day.)
Besides iShares’ IYW, IYE, and IDU, other highly-ranked ETFs in our SectorCast model (which scores over 600 US-listed equity ETFs) from the Technology, Energy, and Utilities sectors include PowerShares Dynamic Semiconductors Portfolios (PSI), VanEck Vectors Uranium Nuclear Energy (NLR), and John Hancock Multifactor Utilities (JHMU).
An assortment of other ETFs that are scoring well in our rankings include SPDR S&P Pharmaceuticals (XPH), VanEck Vectors BDC Income (BIZD), Oppenheimer Financials Sector Revenue (RWW), iShares US Home Construction (ITB), US Global Jets (JETS), ALPS Sprott Buzz Social Media Insights (BUZ), Innovator IBD 50 Fund (FFTY), and SPDR Russell 2000 Low Volatility (SMLV).
However, if you prefer a neutral bias, the Sector Rotation model suggests holding Technology, Healthcare, and Financial, in that order. On the other hand, if you are more comfortable with a defensive stance on the market, the model suggests holding Financial, Basic Materials, and Technology, in that order (even though those would typically show up in a bullish portfolio!).
Disclosure: Scott Martindale is ...
more

