
New Stocks On Exec Comp & ROIC Model Portfolio: July 2017

Photo Credit: Keith Cooper (Flickr)
One new stock makes July’s Exec Comp Aligned With ROIC Model Portfolio, which was made available to members on 7/13/17.
Recap from June’s Picks
Our Exec Comp Aligned With ROIC Model Portfolio (-3.1%) underperformed the S&P 500 (-0.3%) last month. The best performing stock in the portfolio was Insteel Industries (IIIN), which was up 5%. Overall, seven out of the 15 Exec Comp Aligned With ROIC Stocks outperformed the S&P in May and six had positive returns.
Since inception, this model portfolio is up 24% while the S&P 500 is up 18%.
The success of this Model Portfolio highlights the value of our Robo-Analyst technology, which scales our forensic accounting expertise (featured in Barron’s) across thousands of stocks.
This Model Portfolio only includes stocks that earn an Attractive or Very Attractive rating and align executive compensation with improving ROIC. We think this combination provides a uniquely well-screened list of long ideas because return on invested capital (ROIC) is the primary driver of shareholder value creation.
New Stock Feature for July: Foot Locker (FL: $49/share)
Foot Locker (FL), a footwear apparel and accessories retailer, is the lone addition to our Exec Comp Aligned With ROIC Model Portfolio in July.
FL has grown revenue by 3% compounded annually over the past decade. Over the same period, after-tax profit (NOPAT) has grown by 9% compounded annually to $778 million in FY2017. The accelerated NOPAT growth rate has been driven by FL’s rising profit margins. Per Figure 1, NOPAT margin has improved from 6% in 2007 to 10% during the trailing twelve months (TTM).
Figure 1: Foot Locker’s Decade of Profit Growth
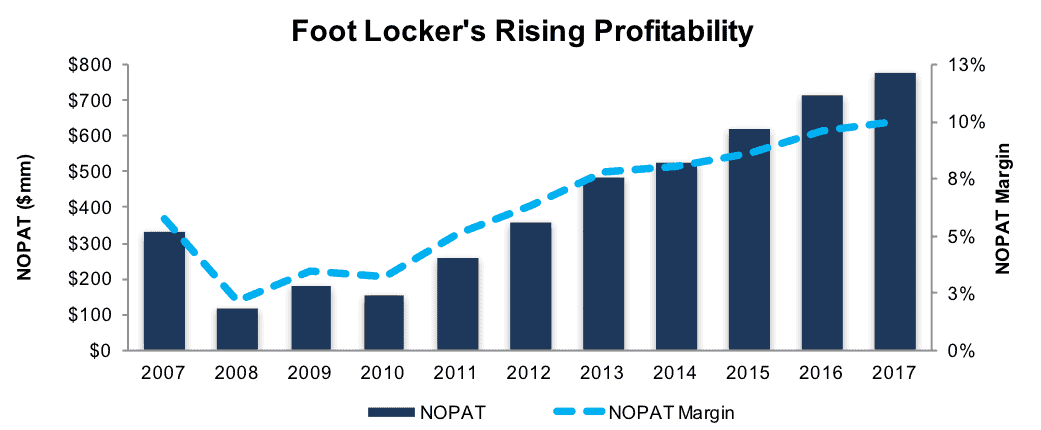
Sources: New Constructs, LLC and company filings
FL currently earns a third-quintile 10% return on invested capital (ROIC) and has generated a cumulative $762 million (12% of market cap) in free cash flow (FCF) over the past five years. FL’s $516 million in FCF over the trailing twelve months equates to a 5% FCF yield compared to 2% for the average S&P 500 stock.
Executive Compensation Plan Incentivizes Shareholder Value Creation
FL’s executive compensation consists of base salary, cash bonuses and long-term incentives paid in a mixture of cash and stock. The long-term incentive plan (LTIP) represents roughly 70% of the CEO’s direct comp and roughly 60% for other executives. The LTIP is based on two-year average net income (70%) and ROIC (30%) targets. ROIC calculations vary across companies, but we view FL’s methodology as relatively accurate.
FL’s use of ROIC to measure performance ensures executives’ interests are aligned with shareholders’ interests. We’ve detailed ways in which ROIC is directly correlated to changes in shareholder value here. Per Figure 2, FL has improved its ROIC to 10% TTM from 6% in 2007 and a low of 2% in 2008.
Figure 2: Improving ROIC Improves Shareholder Value
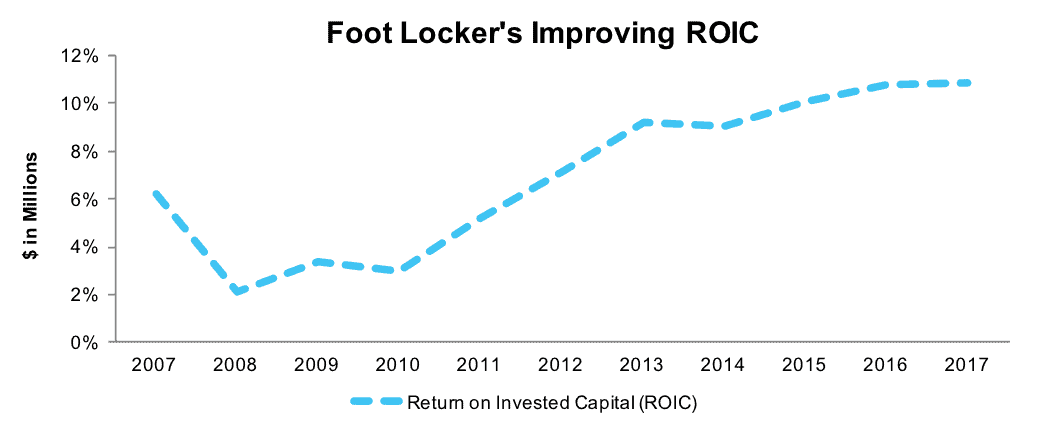
Sources: New Constructs, LLC and company filings
Price Decline Leaves FL Undervalued
FL shares are -15% over the past year and -31% YTD vs. +14% and +10%, respectively, for the S&P 500. Like many retail stocks, sentiment on FL has become very negative due to the combination of slowing sales growth and fear of Amazon’s (AMZN) long-term impact on the industry. In the case of FL, we view the negativity as overdone and believe the magnitude of the price decline amidst favorable fundamentals leaves FL undervalued.
At its current price of $49/share, FL has a price-to-economic book value (PEBV) ratio of 0.5. This ratio means the market expects FL’s NOPAT to permanently decline by 50%. This expectation seems overly pessimistic in light of FL’s compound annual NOPAT growth of 5% since 1998 and 9% over the past decade.
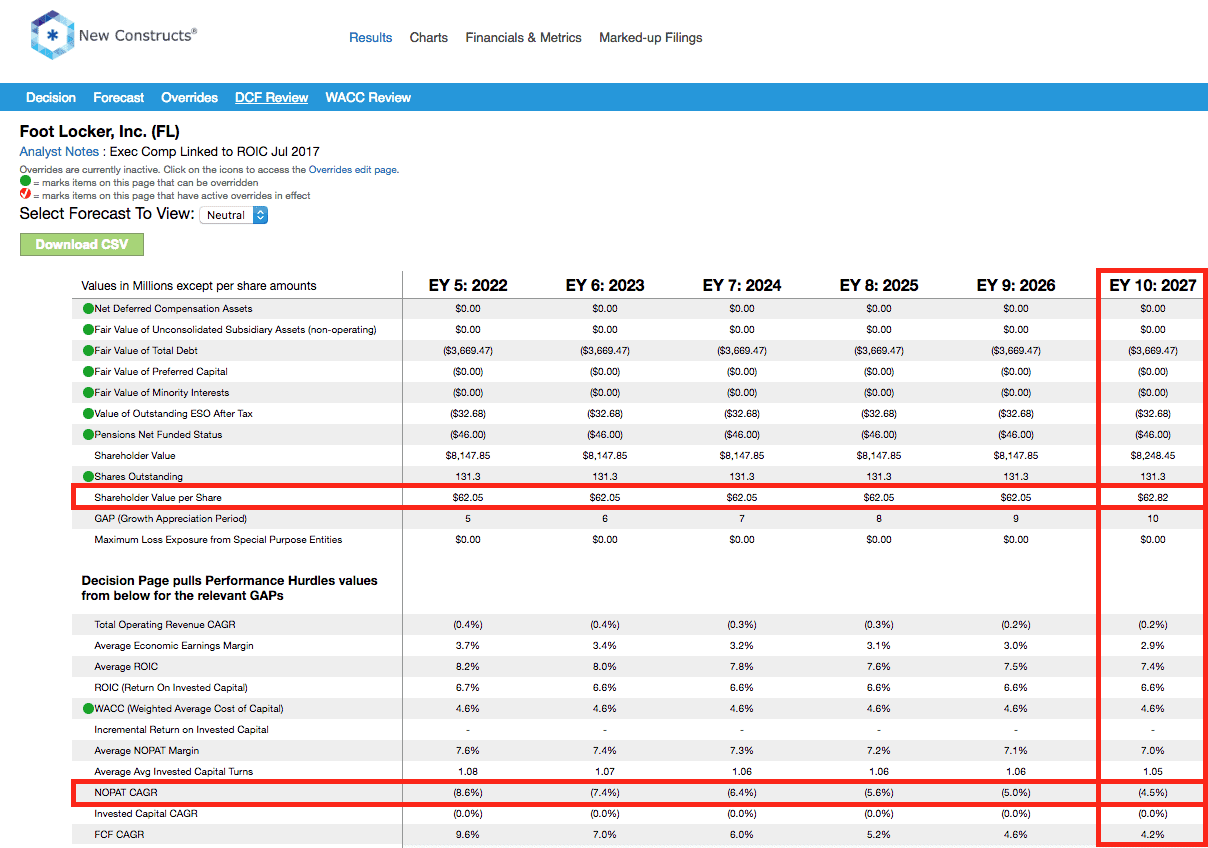
Even if current NOPAT margins (10%) revert to the ten-year average of 7% and NOPAT declines by 5% compounded annually for the next decade, the stock is still worth $63/share today – a 30% upside. This scenario assumes no revenue growth over the next decade compared to 3% compound annual revenue growth over the past decade.
Impacts of Footnotes Adjustments and Forensic Accounting
Our Robo-Analyst technology enables us to perform forensic accounting with scale and provide the research needed to fulfill fiduciary duties. In order to derive the true recurring cash flows, an accurate invested capital, and a real shareholder value, we made the following adjustments to Foot Locker’s 2017 10-K:
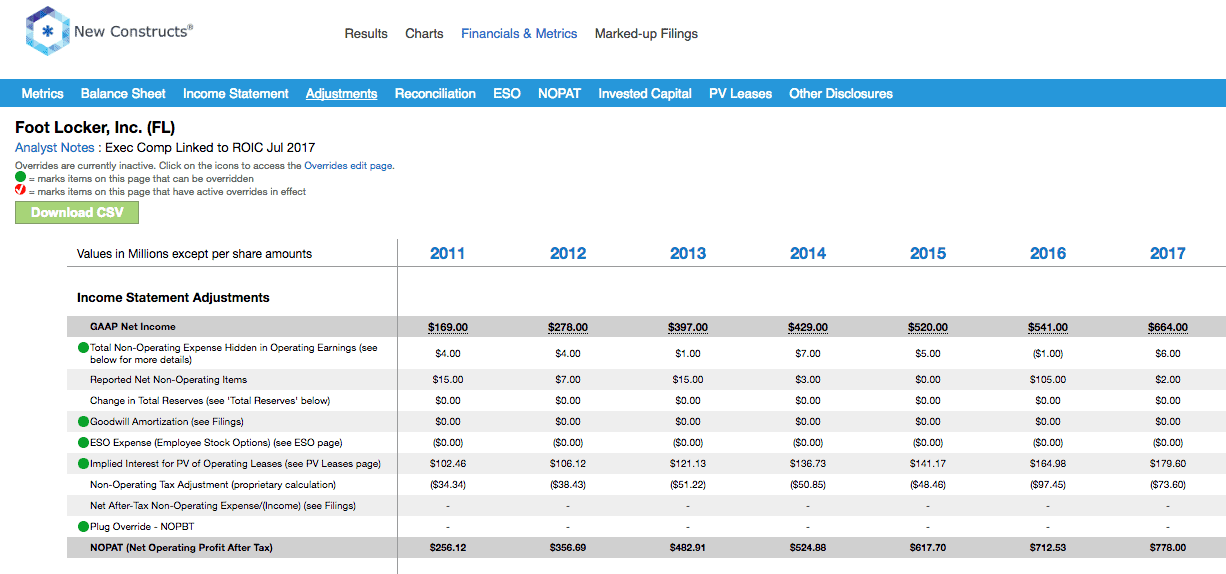
Income Statement: we made $352 million of adjustments, with a net effect of removing $114 million in non-operating expense (1% of revenue). We removed $119 million in non-operating income and $233 million in non-operating expenses. You can see all the adjustments made to FL’s income statement here.
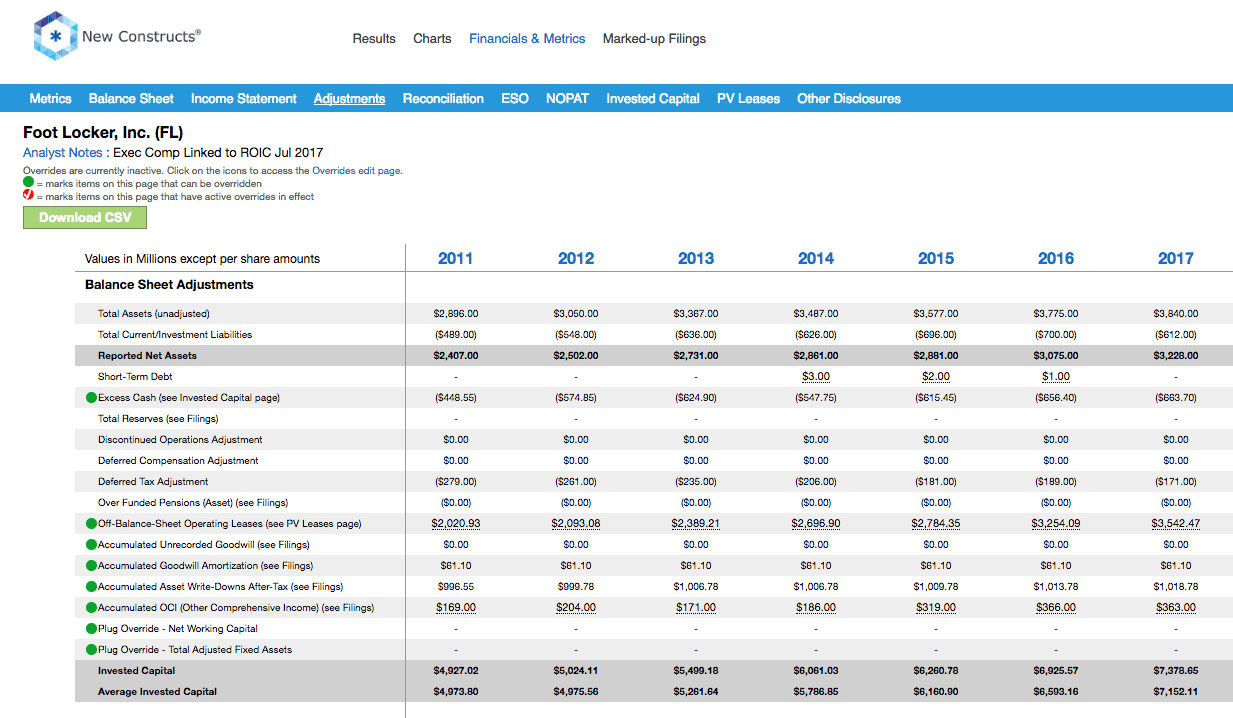
Balance Sheet: we made $6 billion of adjustments to calculate invested capital with a net increase of $3.9 billion. The largest adjustments was $3.5 billion due to operating leases. This adjustment represented 110% of reported net assets. You can see all the adjustments made to FL’s balance sheet here.
Valuation: we made $4.4 billion of adjustments with a net effect of decreasing shareholder value by $3.1 billion. We made $3.7 billion of adjustments that decreased shareholder value and $660 million of adjustments that increased shareholder value. The largest adjustment was $3.7 billion (58% of market cap) for total debt, which includes the operating leases as noted above. Despite the net decrease in shareholder value, FL remains undervalued.
Disclosure: David Trainer, Kenneth James, and Kyle Guske II receive no compensation to write about any specific stock, style, or theme.
Follow us on more


