
New Downtrend Or Just Downward Correction?
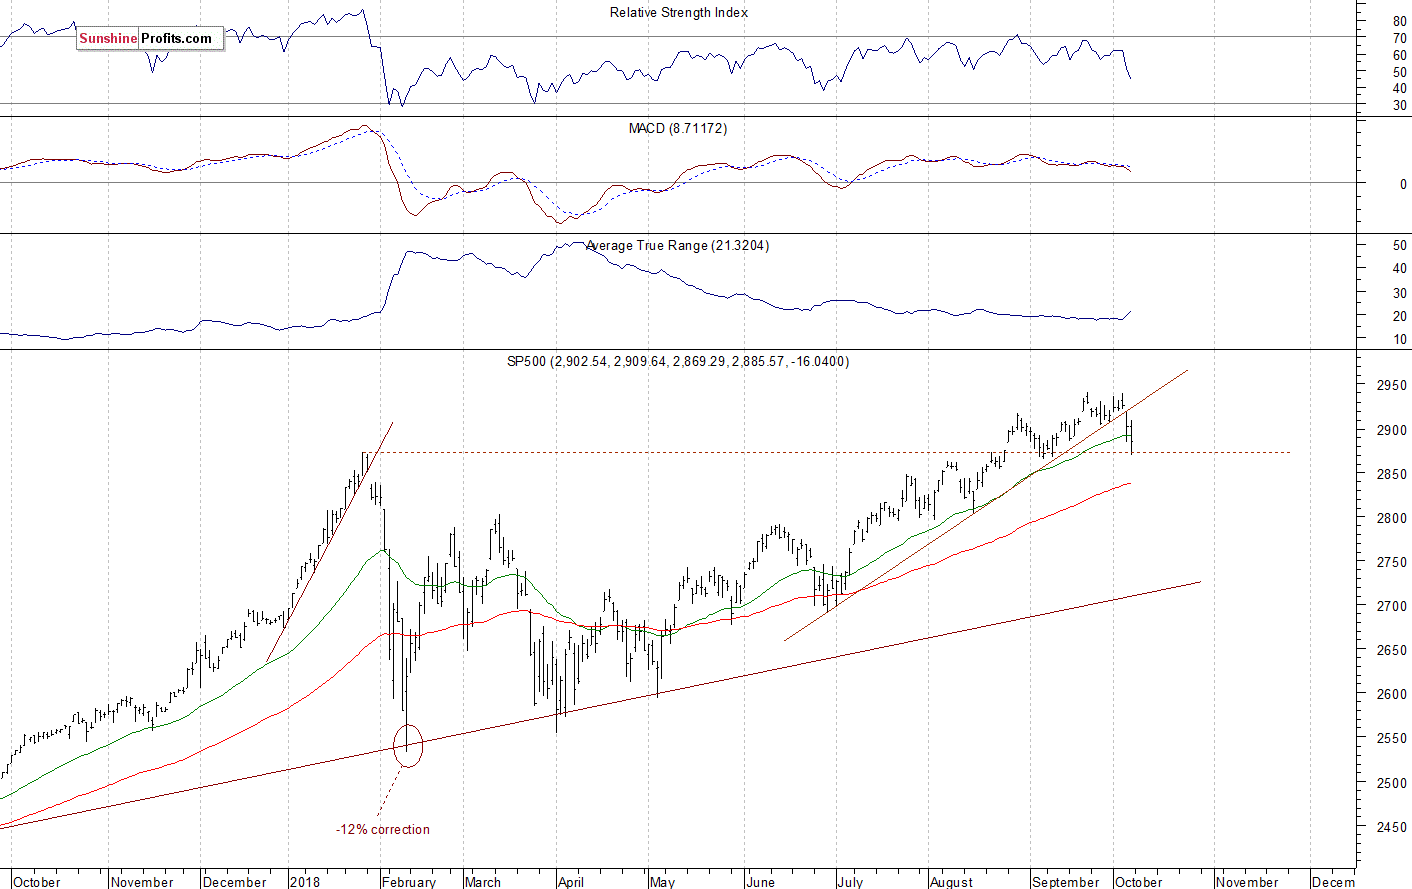
The U.S. stock market indexes lost 0.6-1.1% on Friday, extending their recent decline, as investors reacted to the monthly jobs data release. The S&P 500 index has reached its late January local high of around 2,873, before closing above the level of 2,885. It currently trades 1.9% below September the 21st record high of 2,940.91. The Dow Jones Industrial Average lost 0.7% and the Nasdaq Composite lost 1.2% on Friday, as tech stocks continued to act relatively weak vs. the broad stock market.
The nearest important level of support of the S&P 500 index is now at around 2,870-2,875, marked by the mentioned late January local high. The next support level is at 2,850-2,855, among others. On the other hand, the resistance level is at 2,880-2,900, marked by the recent price action. The level of resistance is also at 2,915-2,920, marked by the Thursday's daily gap down of 2,919.78-2,921.36.
The broad stock market retraced its September's record breaking rally recently, as the S&P 500 index broke below its three-month long upward trend line. Is this a new downtrend or just some medium-term consolidation along the new record high? If the index remains above the late January local high, we could see more fluctuations:
Uncertainty Following the Decline
Expectations before the opening of today's trading session are negative, because the index futures contracts trade 0.3-0.4% below their Friday's closing prices. The European stock market indexes have lost 0.6-0.9% so far. There will be no new important economic data announcements today. The broad stock market will likely fluctuate along its recent local lows today. We may see an attempt at bouncing off a support level of the late January high. But for now, it looks like a flat correction within a downtrend. If the index gets back above the level of 1,900, we could see more buying pressure.
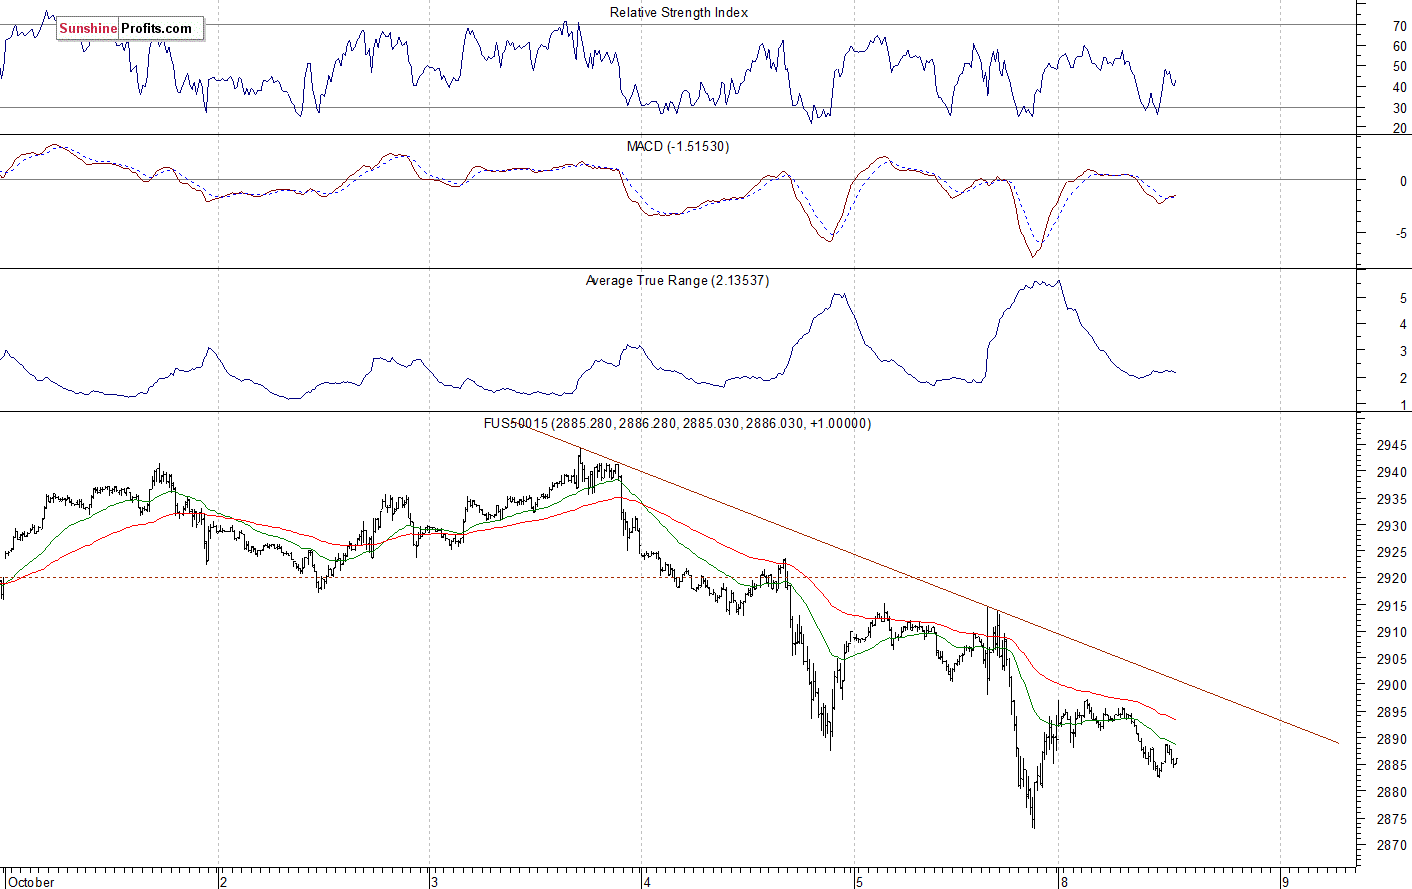
The S&P 500 futures contract trades within an intraday consolidation following an overnight decline. The nearest important level of resistance is now at 2,900, marked by some short-term local highs. The next resistance level is at 2,915-2,920, among others. On the other hand, the support level is now at 2,875-2,880, marked by Friday's local low. The futures contract continues to trade below its short-term downward trend line, as we can see on the 15-minute chart:
Nasdaq: the Lowest Since Late August
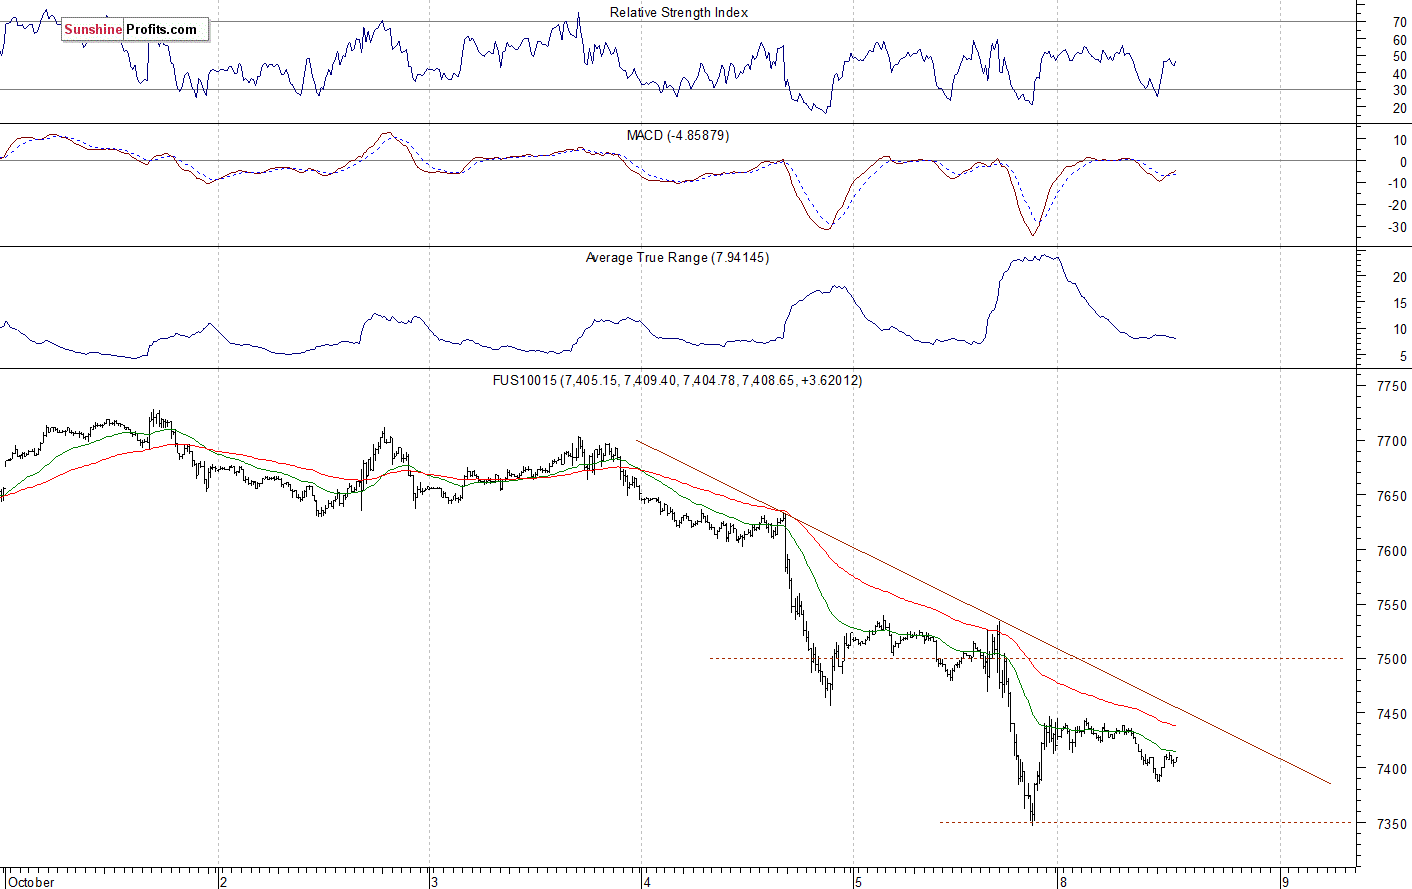
The technology Nasdaq 100 futures contract follows a similar path, as it trades within an intraday consolidation. However, the tech stocks' gauge remains relatively weaker than the broad stock market. It broke below the level of 7,400 on Friday yesterday, as it fell the lowest since late August. The nearest important support level is at around 7,350-7,400, marked by Friday's lows. On the other hand, the resistance level is now at 7,500-7,550, among others. The Nasdaq futures contract trades along the level of 7,400, as the 15-minute chart shows:
Big Cap Tech Stocks Extend Their Recent Losses
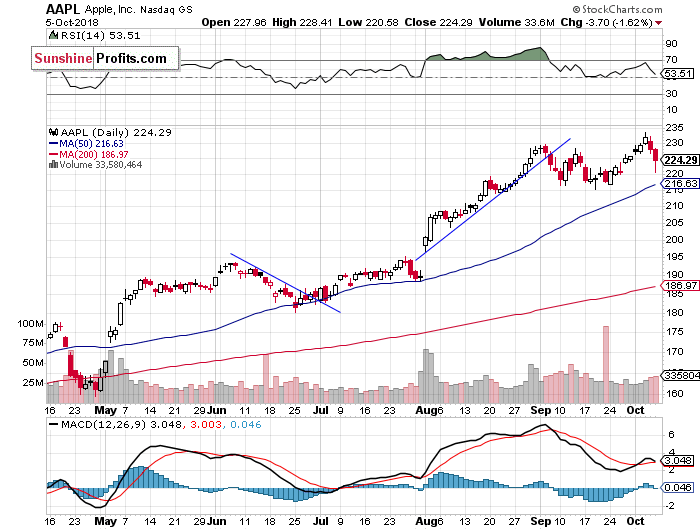
Let's take a look at Apple, Inc. stock (AAPL) daily chart (chart courtesy of http://stockcharts.com). It reached the new record high at the level of $233.47 on Wednesday, as it continued to act relatively strong. Then the stock retraced most of its recent rally. It is currently trading around $9 below the record high. Will it reverse its medium-term uptrend? Or is this just a consolidation before another leg up? There have been no confirmed negative signals so far. However, we still can see some negative technical divergences:
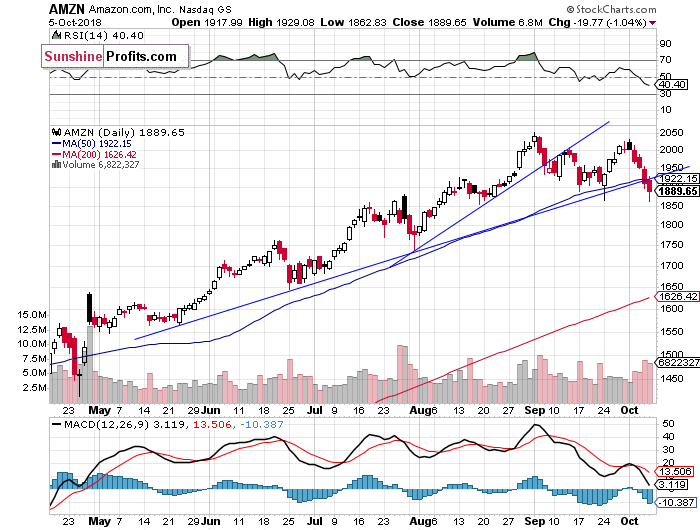
Now let's take a look at Amazon.com, Inc. stock (AMZN) daily chart. It is relatively weaker the Apple stock, as it is trading within a clear short-term downtrend. The stock broke below its medium-term upward trend line on Friday. But will it continue below the recent local low of $1,865? If it does, we could see more selling pressure:
Dow Jones Also Lower
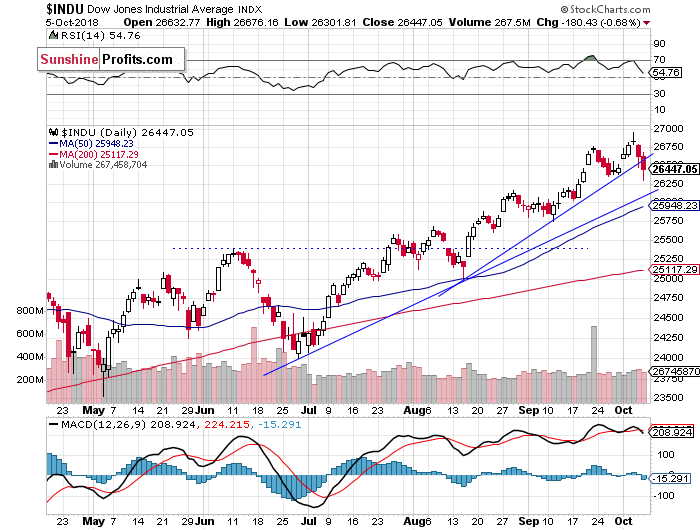
The Dow Jones Industrial Average reached its new all-time high at the level of 26,951.81 on Wednesday. Since then it was trading downwards. The blue-chip stocks' gauge broke below the two-month-long upward trend line on Friday. But will it continue towards the medium-term upward trend line and the support level of around 26,000? The resistance level remains at 27,000. For now, it looks like a downward correction within an uptrend:
The S&P 500 index retraced its September advance recently, as investors' sentiment worsened following the bond yield's surge, among other factors. The broad stock market's gauge fell to its late January local high on Friday. Will it bounce off the medium-term support level or continue lower? If the index breaks below the level of 2,870, we could see more selling pressure.
Concluding, the S&P 500 index will probably open lower today. We may see an attempt at bouncing off the support level again. But if the bulls fail, we may see more downward pressure. There have been no confirmed short-term positive signals so far.
Disclosure: None.


