
Negative Signs For EUR/USD?
Monday's session discovered currency bulls’ weakness, which was mercilessly used by their opponents during yesterday's trading. Thanks to the sellers’ attack, EUR/USD hit a fresh 2018 low, but will we see further declines in the coming days?
EUR/USD at Fresh 208 Lows
(Click on image to enlarge)
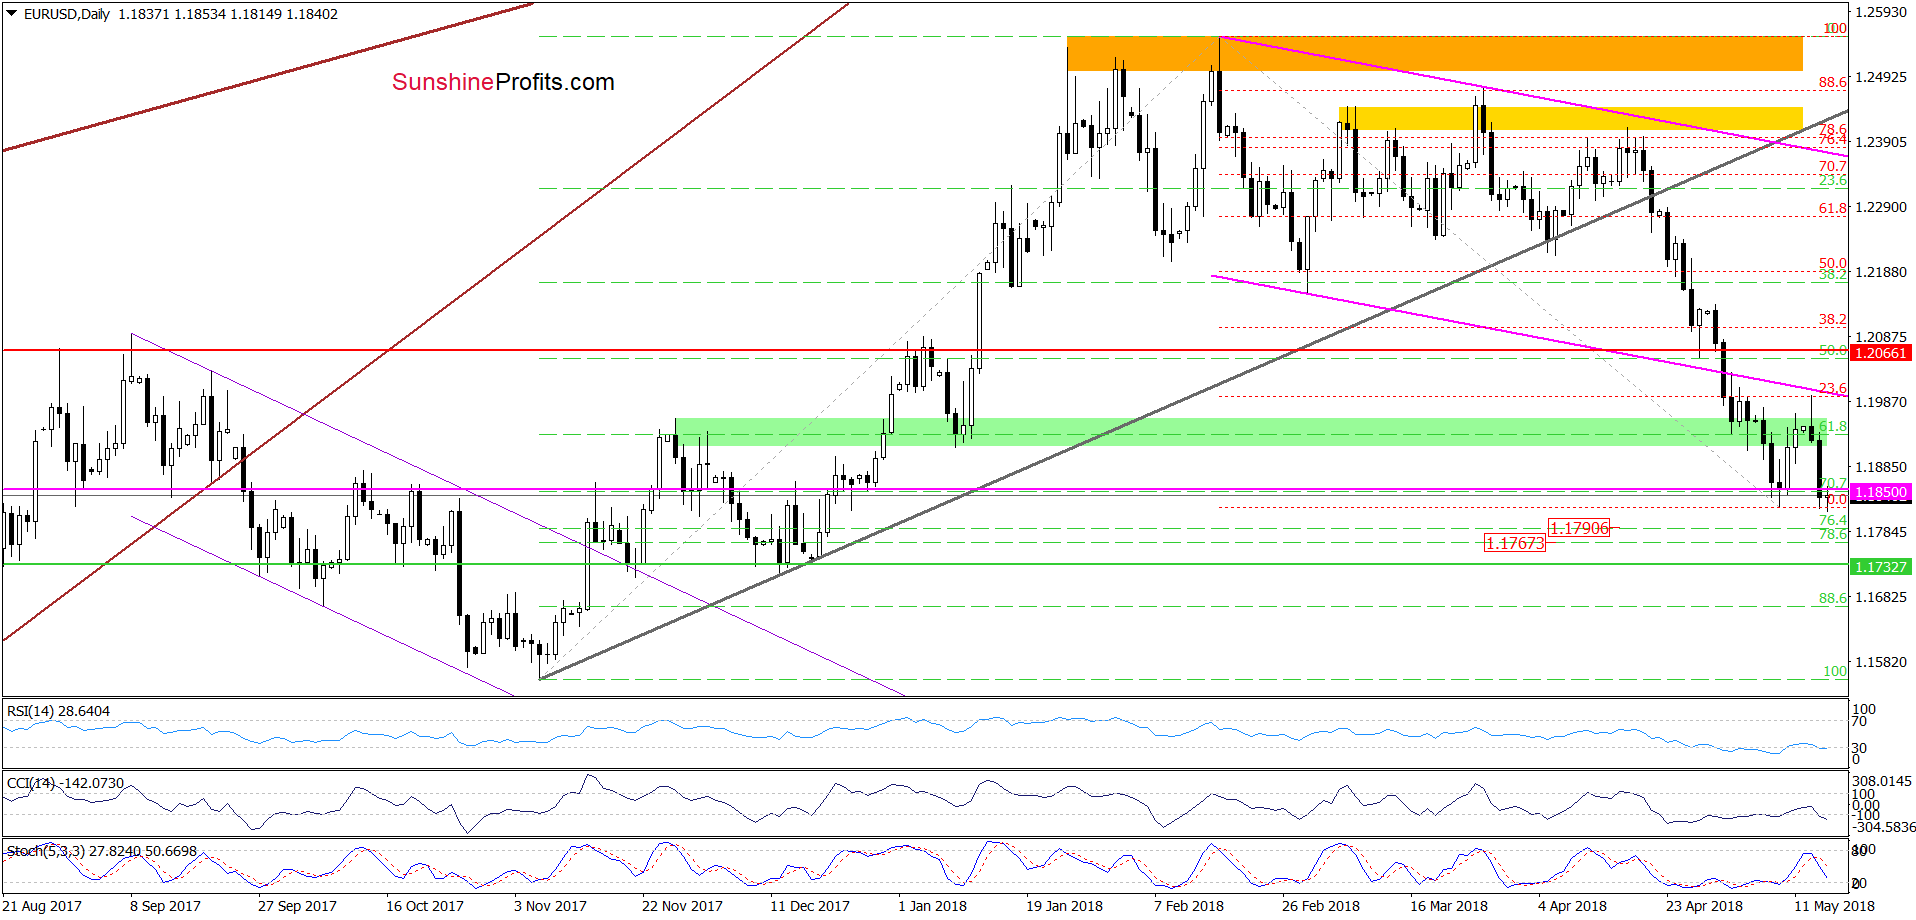
In our yesterday’s Forex Trading Alert, we wrote that currency bulls confirmed their weakness (…), which resulted in a pullback and a comeback to the green zone. Additionally, earlier today, the Stochastic Oscillator generated a sell signal, which suggests that the worst may not be behind the buyers yet and another move to the downside is just around the corner.
If this is the case, and the exchange rate declines from current levels, we could see at least a test of the 70.7% Fibonacci retracement and the last week’s low.
From today’s point of view, we see that the situation developed in line with the above scenario and EUR/USD slipped to our first downside target yesterday, making our short positions profitable.
What’s next? Taking into account Tuesday’s sellers’ strength and the above-mentioned sell signal generated by the Stochastic Oscillator, we think that EUR/USD will extend losses and test our next downside target around 1.1767-1.1790, where the support area created by the 76.4% and 78.6% retracements is.
USD/CHF vs. Major Resistance Area
(Click on image to enlarge)
(Click on image to enlarge)
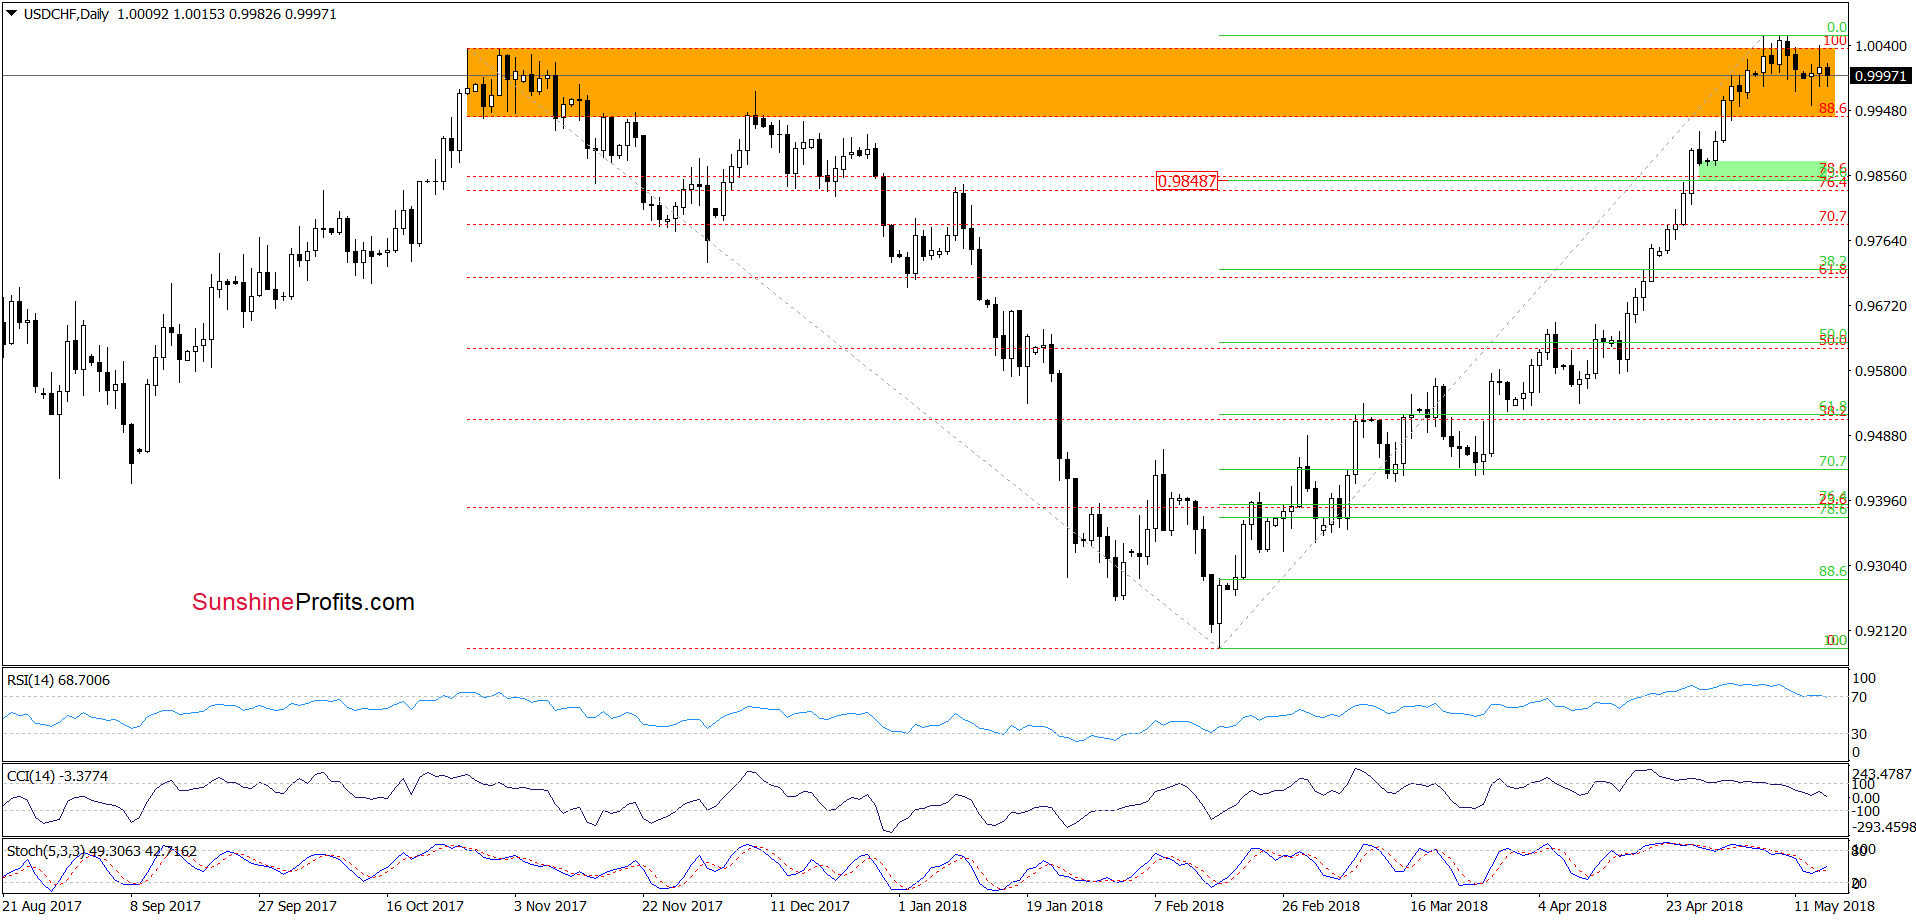
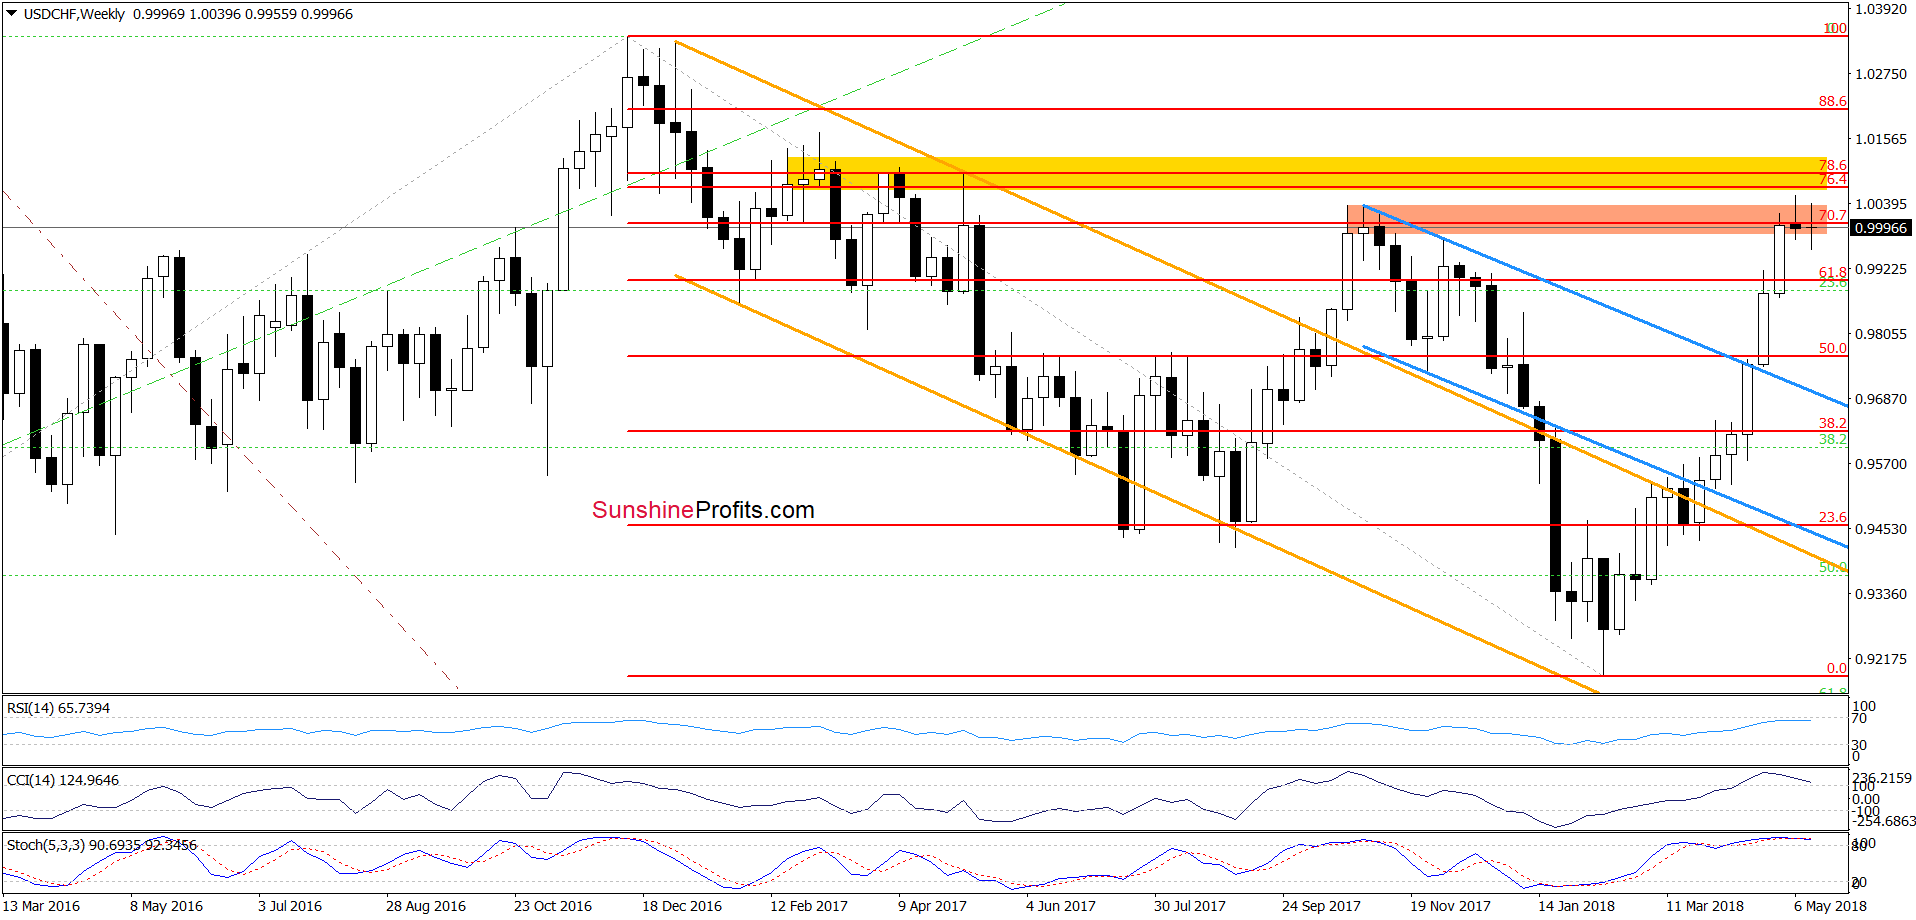
Looking at the above charts, we see that the overall situation in the short term hasn’t changed much as USD/CHF is still trading inside the orange resistance zone. Therefore, we believe that as long as there is no breakout above this area or a breakdown under the previously-broken 88.6% Fibonacci retracement another bigger move is not likely to be seen.
Nevertheless, we should keeo in mind that even if the buyers push the pair higher (using the buy signal generated by the Stochastic Oscillator) the way to the north is blocked by the 70.7% Fibonacci retracement and the yellow resistance zone (seen on the weekly chart), which stopped the rally and triggered a pullback in the previous week.
And what could happen if USD/CHF drops under the orange zone? In our opinion, if the exchange rate slips under the lower border of this area, we could see a drop to around 0.9850-0.9875, where the green support zone (marked on the daily chart) is.
AUD/USD - Battle Around Lower Border of Trend Channel
(Click on image to enlarge)
(Click on image to enlarge)
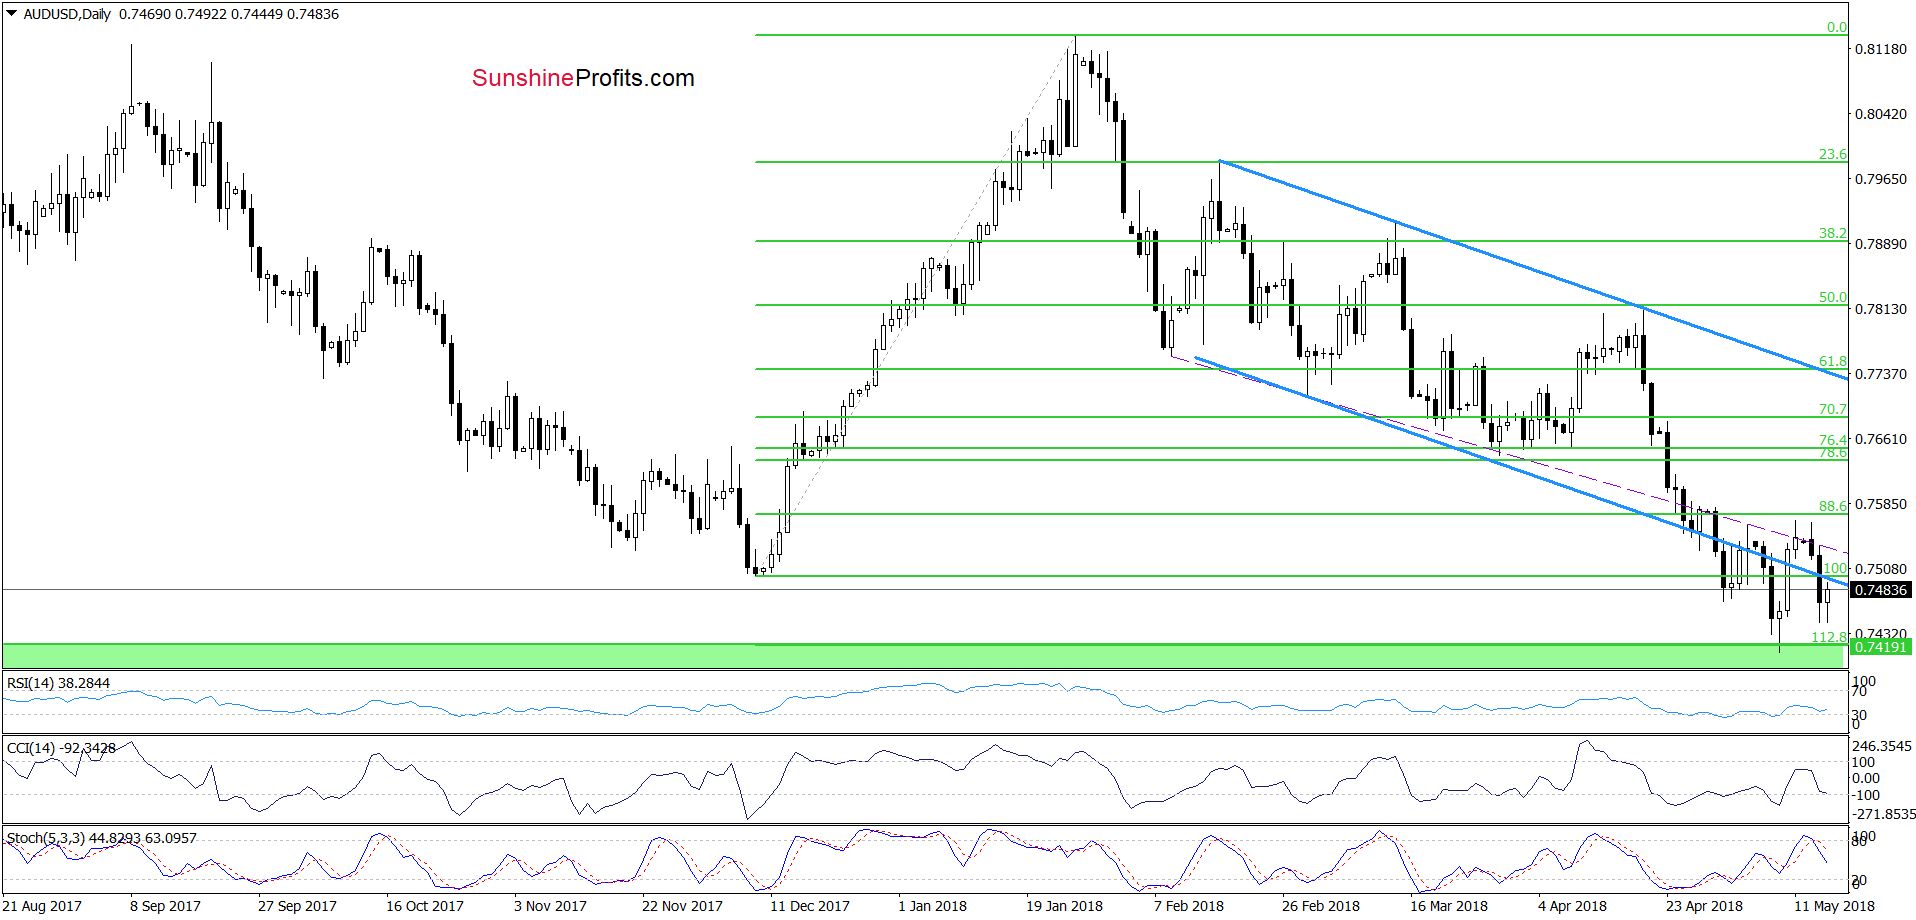
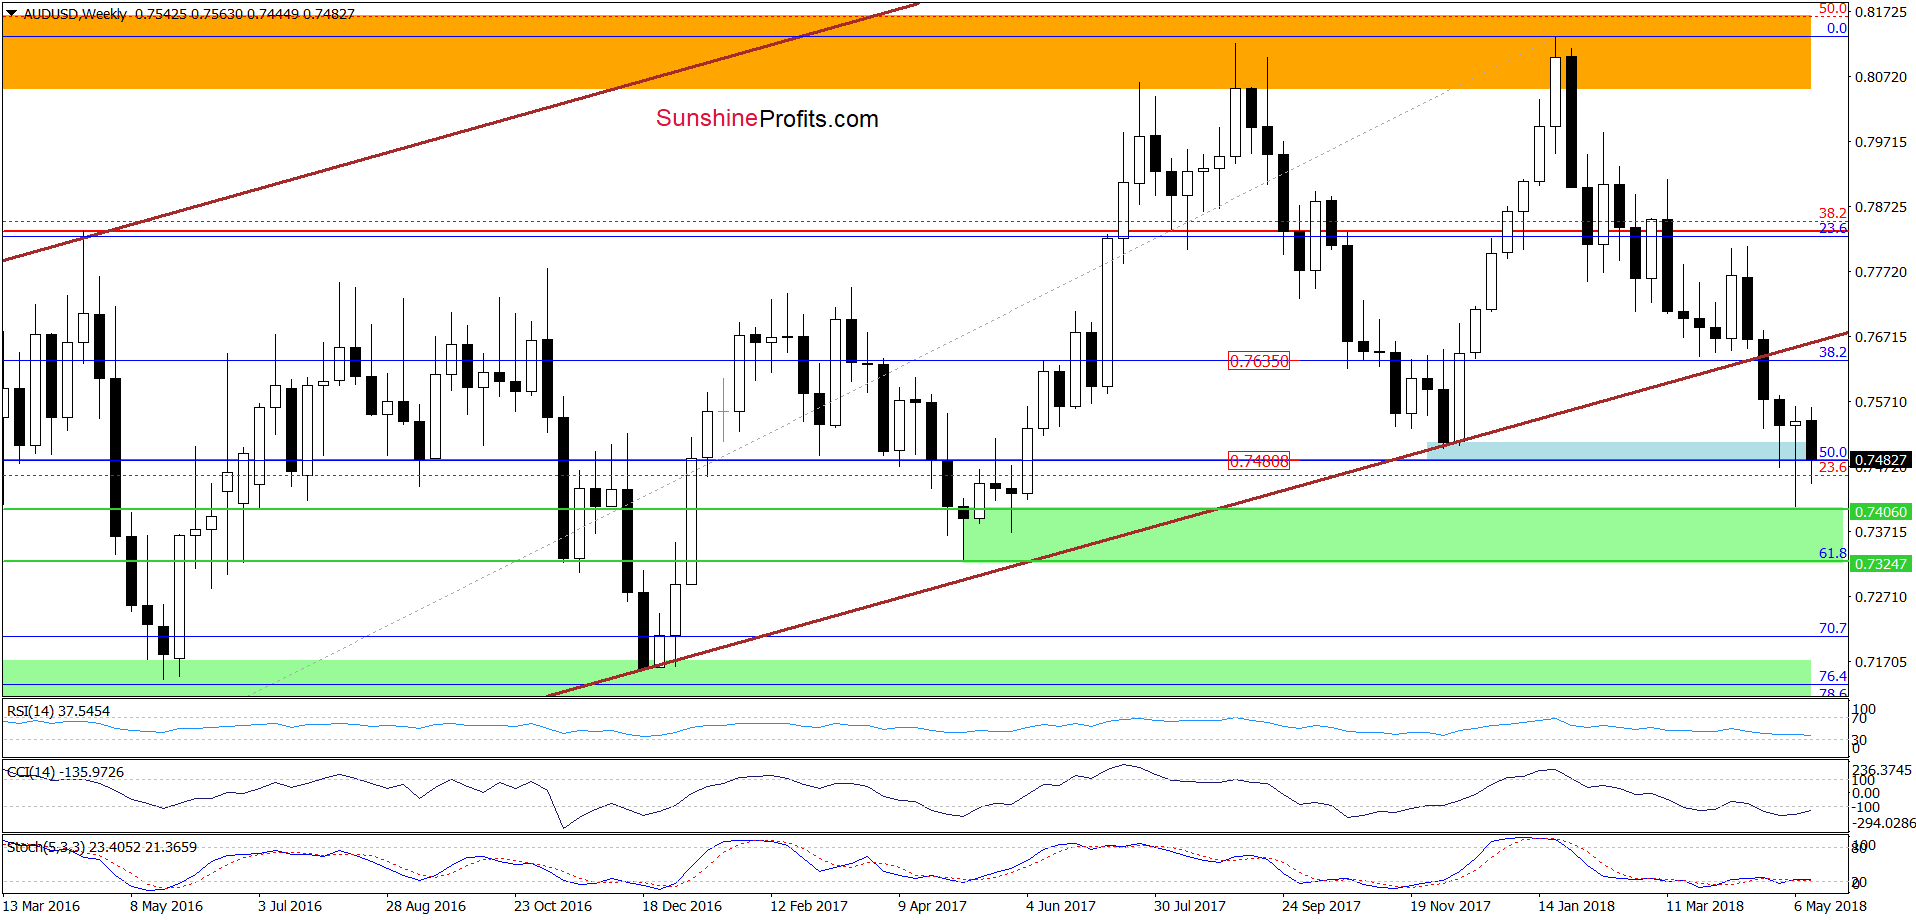
On the daily chart, we see that although currency bulls managed to take AUD/USD above the previously-broken lower border of the blue declining trend channel at the end of the last week, this improvement was very temporary.
Why? Because their opponents showed strength and invalidated the earlier breakout yesterday, triggering a quite sharp decline. This is a bearish development, which in combination with the sell signal generated by the Stochastic Oscillator suggests that we could see a re-test of the May low and the green support zone in the coming day(s).


