
Negative Expectations Following Fed, But Will S&P 500 Continue Lower?
Our intraday outlook is now bearish, and our short-term outlook is bearish. Our medium-term outlook remains neutral, following S&P 500 index breakout above last year's all-time high:
Intraday outlook (next 24 hours): bearish
Short-term outlook (next 1-2 weeks): bearish
Medium-term outlook (next 1-3 months): neutral
Long-term outlook (next year): neutral
The main U.S. stock market indexes were mixed between -0.4% and +0.2% on Wednesday, extending their short-term fluctuations following last Friday's technology stocks' sell-off, as investors reacted to economic data releases, including the FOMC Interest Rates Increase announcement. All the main stock market indexes have reached new all-time highs recently.
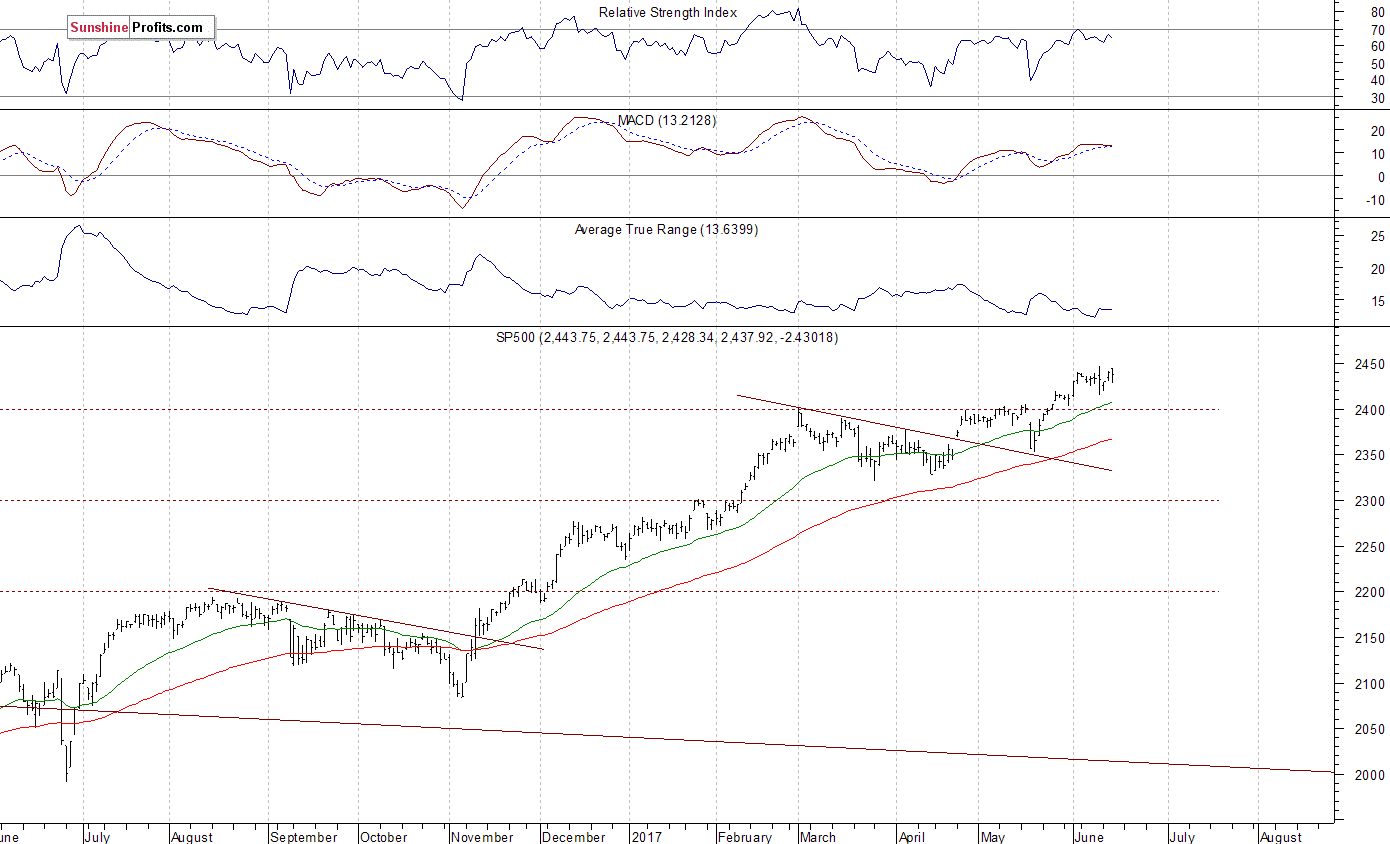
The S&P 500 index trades just 0.3% below its new record high of 2,446.20. It has broken above week-long consolidation along 2,400 mark. Stocks have rebounded strongly after their mid-May quick two-session sell-off and continued over eight-year-long bull market off 2009 lows. The Dow Jones Industrial Average has reached yet another new record high at the level of 21,391.97 yesterday.
The technology Nasdaq Composite index retraced some of its recent rebound, as it closed slightly below the level of 6,200. The nearest important resistance level of the S&P 500 index remains at around 2,440-2,450, marked by new record high, among others. On the other hand, support level is at around 2,415-2,420, marked by previous resistance level. The next support level is at 2,400-2,410, marked by the May 25 daily gap up of 2,405.58-2,408.01, among others. The support level is also at 2,390-2,395, marked by some short-term local lows. Will the uptrend continue towards 2,500 mark? There have been no confirmed negative signals so far. However, we can see some overbought conditions and negative technical divergences. The S&P 500 index is currently trading within a two-week-long consolidation, as we can see on the daily chart:
(Click on image to enlarge)
Sentiment Worsens Again
Expectations before the opening of today's trading session are negative, with index futures currently down 0.4-1.0% vs. their Wednesday's closing prices. The European stock market indexes have lost 1.0-1.1% so far. Investors will now wait for series economic data announcements: Initial Claims,Empire Manufacturing Index, Philadelphia Fed number at 8:30 a.m., Industrial Production, Capacity Utilization at 9:15 a.m., NAHB Housing Market Index at 10:00 a.m. The market expects that Initial Claims were at 240,000 last week, and Industrial Production was unchanged in May.
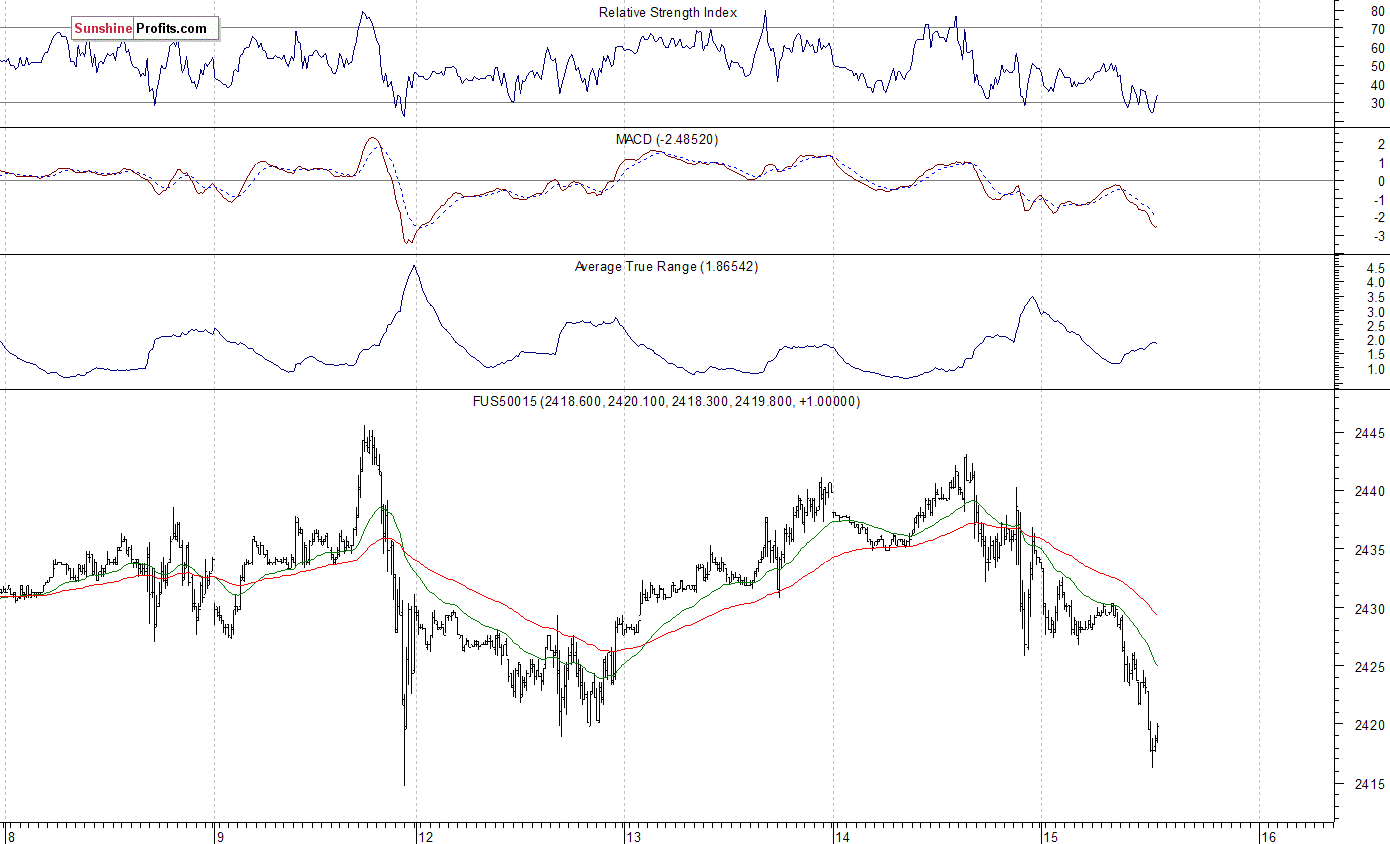
The S&P 500 futures contract trades within an intraday downtrend following an overnight breakdown below its yesterday's trading range. It gets closer to last Friday's local low at around 2,415. The nearest important level of support is at 2,400-2,415, and the next support level is at 2,385-2,395, among others. On the other hand, resistance level is at 2,425-2,430, marked by previous level of support. The resistance level is also at 2,440-2,445, marked by last Friday's new all-time high. The market trades within a short-term consolidation, as it is still above the early March local high. However, we can see some short-term overbought conditions, along with negative technical divergences:
(Click on image to enlarge)
Another Tech Stocks Sell-Off?
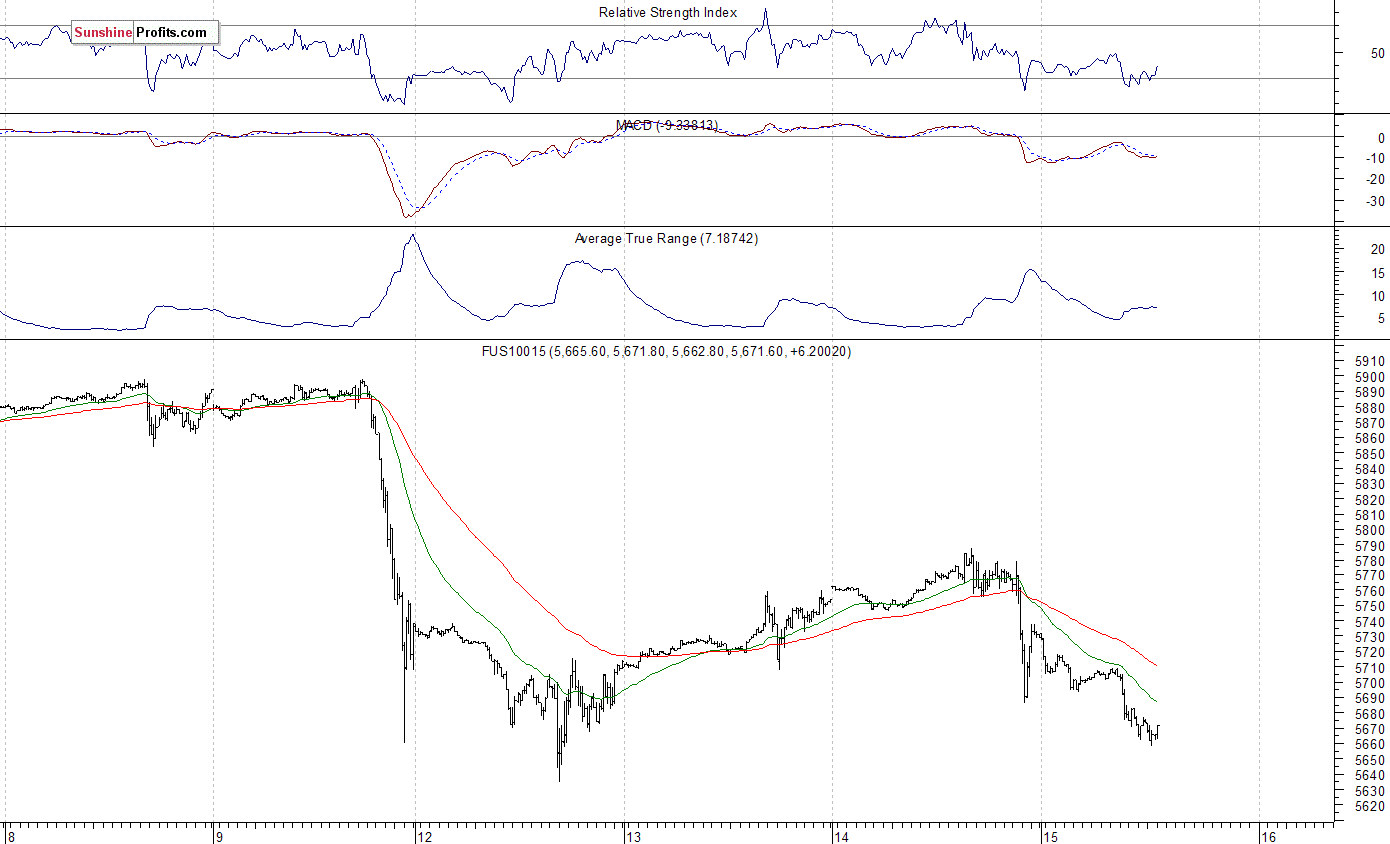
The technology Nasdaq 100 futures contract follows a similar path, as it currently retraces most of its recent rebound off last Friday's local low. The nearest important level of resistance is at around 5,690-5,700, marked by previous support level. The next resistance level is at 5,730-5,750, marked by previous fluctuations. On the other hand, support level is at around 5,630-5,650, marked by local low. The next important level of support is at 5,600-5,620. There have been no confirmed positive signals so far:
(Click on image to enlarge)
Concluding, the S&P 500 index extended its short-term fluctuations on Wednesday, as it lost 0.1% following Tuesday's move up. It remains relatively close to last Friday's record high. Is this a topping pattern before some more meaningful downward reversal? Or just flat correction within medium-term uptrend? There have been no confirmed negative signals so far. However, we can see some negative technical divergences, along with medium-term overbought conditions.
Disclosure: None.


thanks