
Negative Expectations, But..
The U.S. stock market indexes gained 0.1-0.2% on Friday, as the investors hesitated following Thursday's rebound off support level. The S&P 500 index extended its week-long consolidation. It currently trades 5.3% below the January's 26th record high of 2,872.87. The Dow Jones Industrial Average gained 0.2% and the technology Nasdaq Composite gained 0.1% on the last trading day of the month and the quarter.
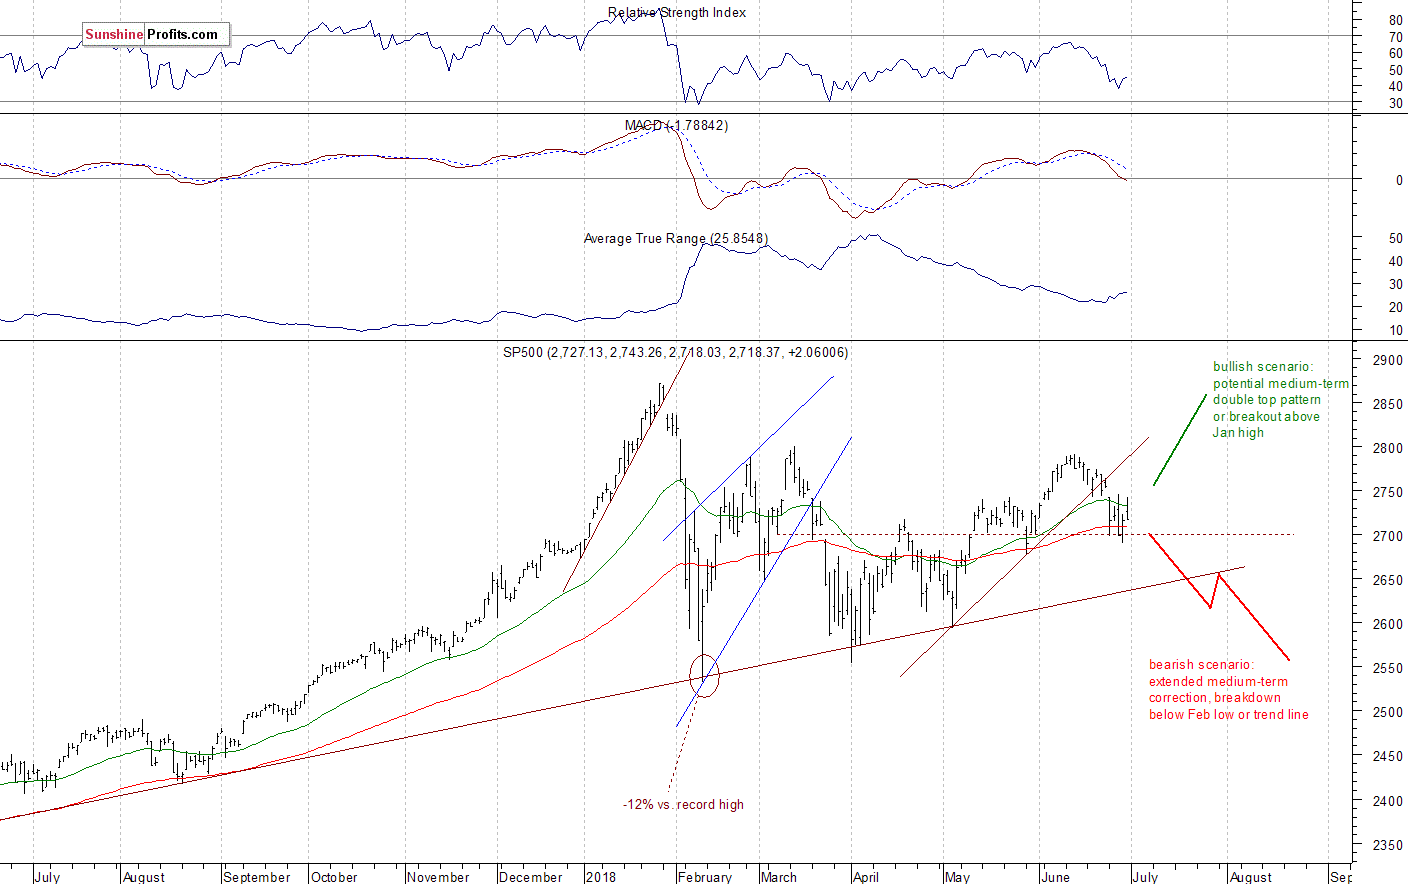
The nearest important level of resistance of the S&P 500 index remains at around 2,740-2,750, marked by the previous support level along with last Monday's daily gap down of 2,742.94-2,752.68 and the recent local highs. The next resistance level is at 2,780-2,800, On the other hand, the support level is at around 2,695-2,700, marked by the recent daily lows. The support level is also at 2,675-2,680, marked by the late May local low.
The broad stock market accelerated its short-term downtrend a week ago, as the S&P 500 index fell the lowest since the end of May. Will the downtrend continue? Or was it some final panic selling before an upward reversal? It's hard to say. If the index breaks below 2,700 mark, we could see more downward action. There are still two possible medium-term scenarios - bearish that will lead us below the February low following trend line breakdown, and the bullish one in a form of medium-term double top pattern or a breakout towards 3,000 mark. There is also a chance that the market will just go sideways for some time, and that would be positive for bulls in the long run (some kind of an extended flat correction). The S&P 500 index broke below its two-month-long upward trend line recently:
Negative Expectations, Closer to Breakdown?
The index futures contracts trade 0.5-0.8% below their Friday's closing prices. So expectations before the opening of today's trading session are negative. The European stock market indexes have lost 0.5-1.0% so far. Investors will wait for some economic data announcements: ISM Manufacturing PMI number, Construction Spending at 10:00 a.m. The broad stock market will likely retrace a large part of its last week's Thursday's-Friday's rebound at the opening of today's trading session following the overnight trade tariffs news release. Will the broad stock marked continue lower? There have been no confirmed positive signals so far.
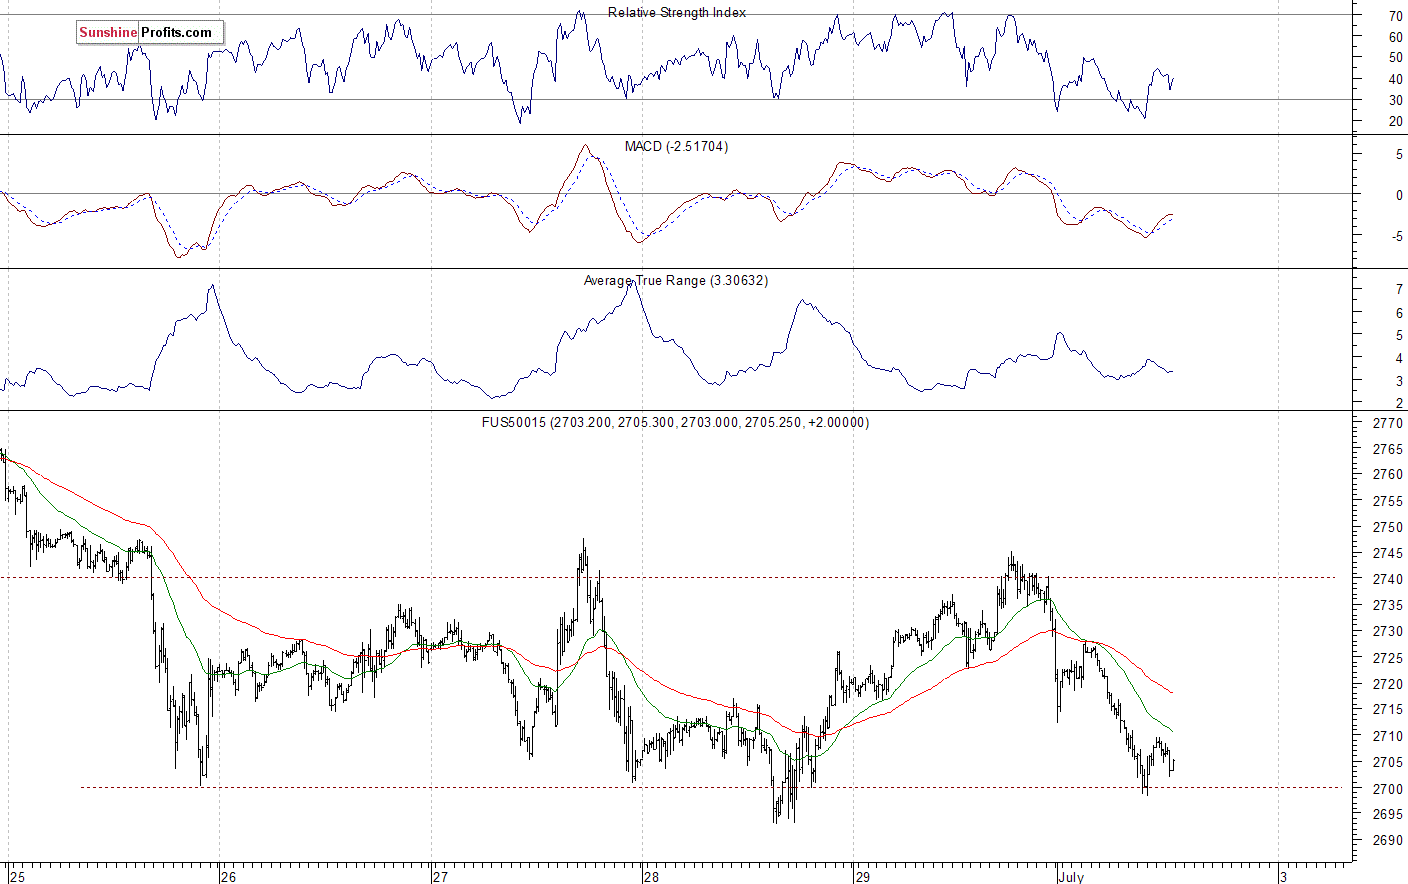
The S&P 500 futures contract trades within an intraday downtrend, as it slightly extends its overnight decline. However, it keeps bouncing off support level of around 2,700. The nearest important level of resistance is at 2,720-2,725, marked by short-term local highs. The futures contract trades closer to the support level again, as we can see on the 15-minute chart:
Nasdaq Also Lower, Close to 7,000 Again
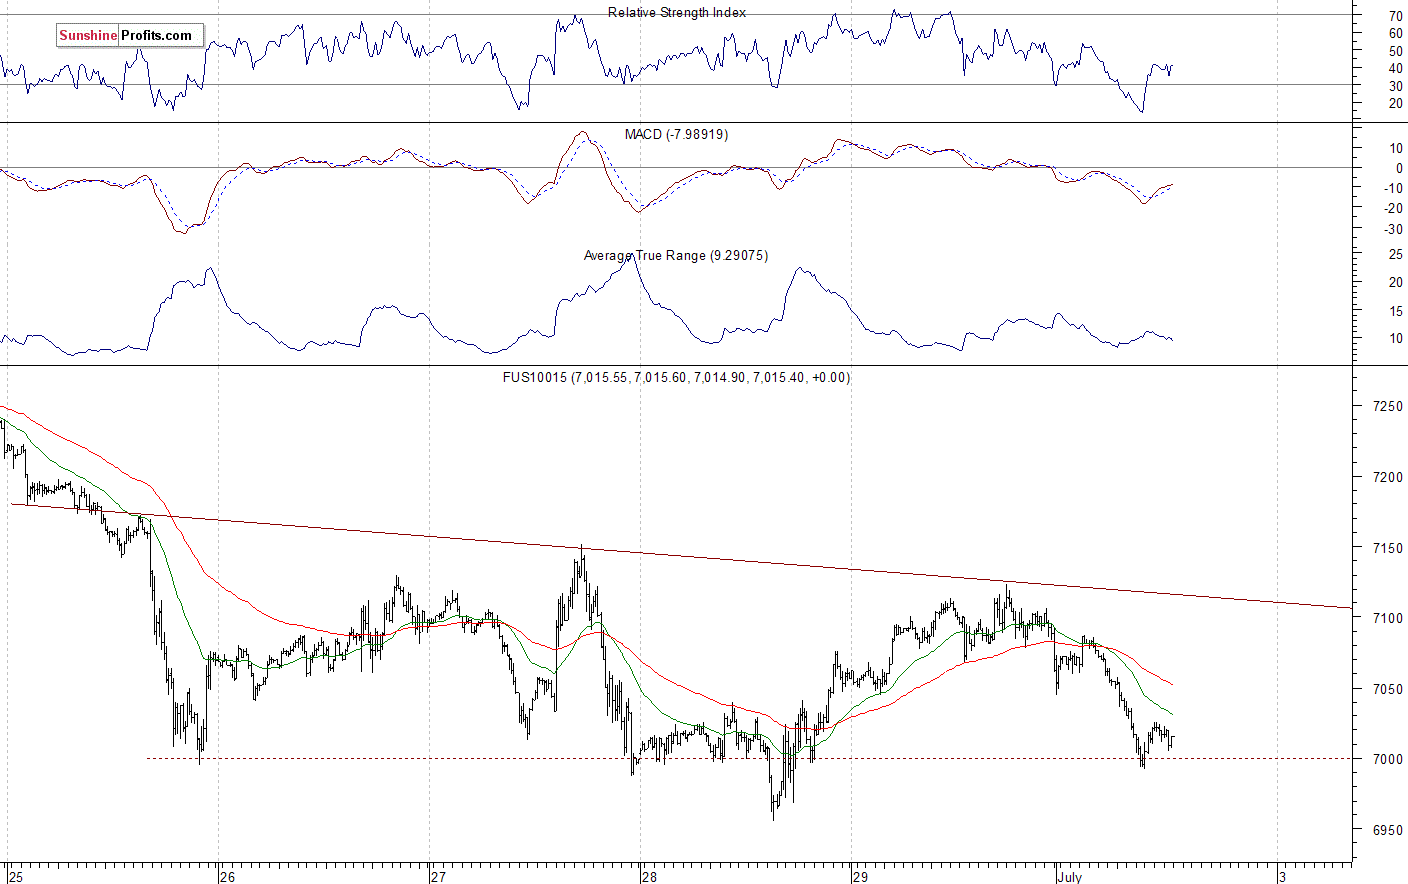
The technology Nasdaq 100 futures contract follows a similar path, as it trades within an intraday downtrend. It retraced most of its recent advance this morning, but the market remains close to the support level of 7,000. On the other hand, the resistance level remains at around 7,100-7,150. The Nasdaq futures contract extends its short-term consolidation along the level of 7,000, as the 15-minute chart shows:
Apple, Amazon Going Sideways
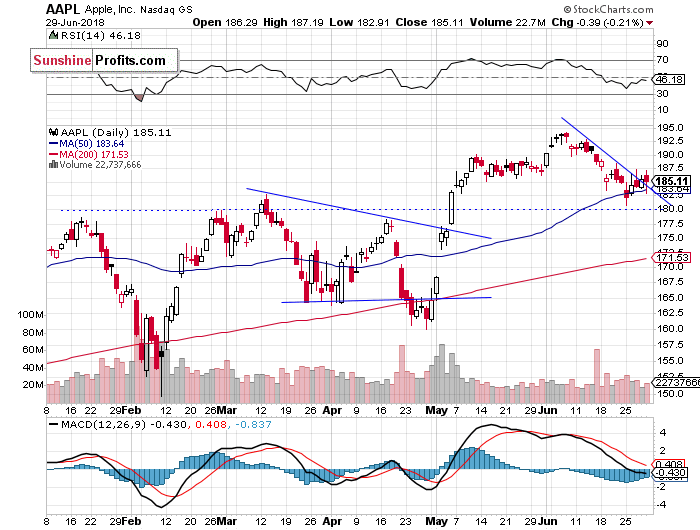
Let's take a look at Apple, Inc. stock (AAPL) daily chart (chart courtesy of StockCharts). It traded within a short-term downtrend since the beginning of June. The decline accelerated a week ago, as the price got closer to a potential support level of $180. Then it rebounded and broke slightly above its downward trend line. Was it an upward reversal? For now, it looks like a short-term consolidation:
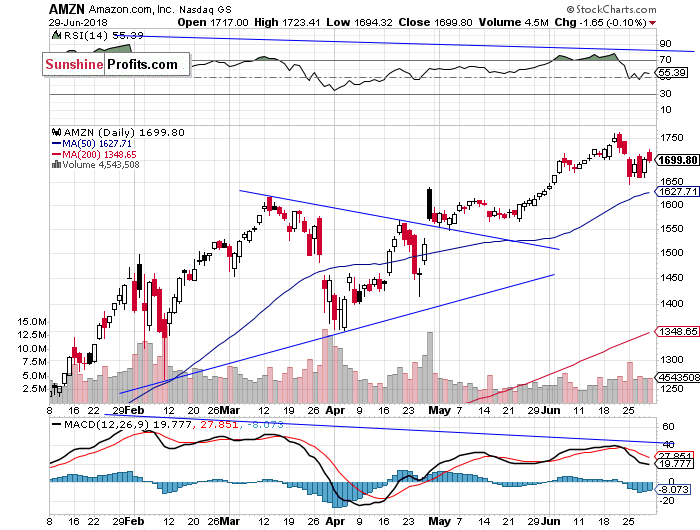
Now let's take a look at Amazon.com, Inc. stock (AMZN) daily chart. It reached the new record high more than a week ago, as it was relatively much stronger than the broad stock market. Then it reversed its short-term uptrend and accelerated lower. We saw negative technical divergences. They signaled a potential downward reversal. The level of resistance remains at around $1,700, but the price keeps bouncing off $1,650:
Dow Jones Still at 200-day Moving Average
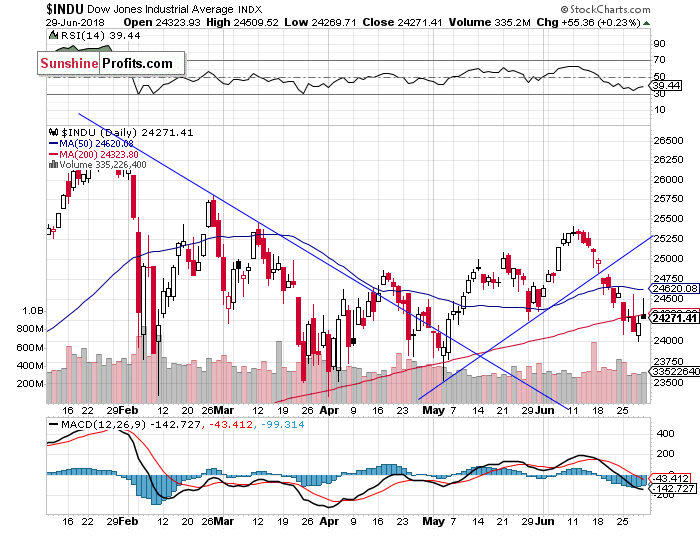
The Dow Jones Industrial Average broke below its two-month-long upward trend line two weeks ago. Then it continued lower, as it fell below the level of 24,500. The blue-chip index kept bouncing off a potential support level of around 24,000-24,250 last week. It continues to trade along its 200-day moving average, so it may be some short-term bottoming pattern:
The S&P 500 index traded within a short-term consolidation last week after retracing more of its May-June advance. Was it a downward correction or the new downtrend leading to previous months' lows? For now, it looks like a downward correction, but if the S&P 500 index breaks below the level of 2,700, we could see more selling pressure. And there have been no confirmed short-term positive signals so far.
Concluding, the broad stock market will likely open lower today following an overnight trade tariffs news release. The S&P 500 index may continue to fluctuate along the support level of 2,700. For now, it looks like a downward correction within the medium-term consolidation.
Disclosure: None.


