
Navient Corp. To Outperform Average Market Performance For The Next Year?
For today's edition of our upgrade list, we have UPGRADES to BUY or STRONG BUY with complete forecast and valuation data. They are presented by one-month forecast return. Navient Corporation (NAVI) is our top-rated upgrade this week.
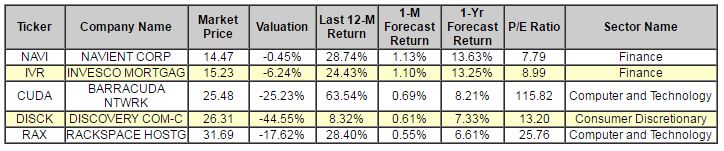
Below is today's data on Navient Corporation (NAVI):
Navient Corporation offers a variety of loan management, servicing and asset recovery services to clients in higher education, and federal, state, and local governments. The Company operates in four segments: Consumer Lending, Business Services, FFELP Loans and Other. The Company acts as a servicer for Department of Education and FFELP loans as well as private student loans. Navient Corporation is based in United States.
Recommendation: We updated our recommendation from BUY to STRONG BUY for NAVIENT CORP on 2016-09-30. Based on the information we have gathered and our resulting research, we feel that NAVIENT CORP has the probability to OUTPERFORM average market performance for the next year. The company exhibits ATTRACTIVE P/E Ratio and Company Size.
|
ValuEngine Forecast |
||
|
Target |
Expected |
|
|---|---|---|
|
1-Month |
14.63 | 1.13% |
|
3-Month |
14.95 | 3.32% |
|
6-Month |
15.19 | 5.00% |
|
1-Year |
16.44 | 13.63% |
|
2-Year |
16.04 | 10.83% |
|
3-Year |
15.63 | 8.00% |
|
Valuation & Rankings |
|||
|
Valuation |
0.45% undervalued |
Valuation Rank |
|
|
1-M Forecast Return |
1.13% |
1-M Forecast Return Rank |
|
|
12-M Return |
28.74% |
Momentum Rank |
|
|
Sharpe Ratio |
-0.11 |
Sharpe Ratio Rank |
|
|
5-Y Avg Annual Return |
-4.19% |
5-Y Avg Annual Rtn Rank |
|
|
Volatility |
37.03% |
Volatility Rank |
|
|
Expected EPS Growth |
6.10% |
EPS Growth Rank |
|
|
Market Cap (billions) |
5.81 |
Size Rank |
|
|
Trailing P/E Ratio |
7.79 |
Trailing P/E Rank |
|
|
Forward P/E Ratio |
7.35 |
Forward P/E Ratio Rank |
|
|
PEG Ratio |
1.28 |
PEG Ratio Rank |
|
|
Price/Sales |
1.17 |
Price/Sales Rank |
|
|
Market/Book |
1.93 |
Market/Book Rank |
|
|
Beta |
2.38 |
Beta Rank |
|
|
Alpha |
-0.11 |
Alpha Rank |
|
Market Overview
|
Summary of VE Stock Universe |
|
|
Stocks Undervalued |
51.95% |
|
Stocks Overvalued |
48.05% |
|
Stocks Undervalued by 20% |
20.77% |
|
Stocks Overvalued by 20% |
16.12% |
Sector Overview
|
Sector |
Change |
MTD |
YTD |
Valuation |
Last 12-MReturn |
P/E Ratio |
|
Multi-Sector Conglomerates |
-0.27% |
-0.67% |
7.28% |
18.23% overvalued |
7.32% |
20.26 |
|
Industrial Products |
-0.76% |
1.64% |
17.67% |
7.32% overvalued |
18.06% |
24.06 |
|
Oils-Energy |
0.55% |
2.74% |
34.10% |
7.12% overvalued |
5.17% |
25.19 |
|
Computer and Technology |
-0.64% |
1.76% |
17.53% |
5.87% overvalued |
14.14% |
30.11 |
|
Consumer Staples |
-0.63% |
-0.44% |
10.13% |
3.44% overvalued |
17.71% |
24.44 |
|
Basic Materials |
-0.60% |
1.05% |
46.43% |
2.71% overvalued |
67.80% |
31.59 |
|
Utilities |
-0.71% |
1.00% |
11.47% |
2.03% overvalued |
18.31% |
22.01 |
|
Aerospace |
-0.81% |
1.56% |
2.33% |
1.49% overvalued |
11.37% |
18.32 |
|
Business Services |
-0.89% |
-0.33% |
13.60% |
0.04% overvalued |
3.38% |
24.75 |
|
Finance |
-0.83% |
-0.46% |
6.63% |
0.12% undervalued |
7.90% |
16.49 |
|
Consumer Discretionary |
-0.48% |
0.53% |
9.06% |
0.55% undervalued |
6.52% |
24.17 |
|
Construction |
-0.86% |
-0.40% |
29.26% |
3.87% undervalued |
18.16% |
20.15 |
|
Medical |
-1.76% |
1.61% |
1.82% |
4.19% undervalued |
-2.52% |
26.88 |
|
Auto-Tires-Trucks |
-1.26% |
1.44% |
6.27% |
4.76% undervalued |
13.34% |
13.80 |
|
Transportation |
-0.41% |
-0.47% |
10.62% |
4.79% undervalued |
-8.63% |
15.35 |
|
Retail-Wholesale |
-0.68% |
-2.29% |
-0.17% |
8.40% undervalued |
-0.13% |
22.03 |
VALUATION WATCH: Overvalued stocks now make up 48.22% of our stocks assigned a valuation and 16.53% of those equities are calculated to be overvalued by 20% or more. Nine sectors are calculated to be overvalued.
Disclaimer: ValuEngine.com is an independent research ...
more

