
Nasdaq McClellan Oscillator Made A Higher High; A Rally Tomorrow?
- SPX Monitoring purposes; Sold SPX on 12/14/16 at 2253.28 = + 2.48%; Long on 11/30/16 at 2198.81.
- Monitoring purposes GOLD: Covered on 11/9/19 at 24.59 = gain .07%: Short GDX 11/2/16 at 24.78.
- Long Term Trend monitor purposes: Short SPX on 1/13/16 at 1890.28
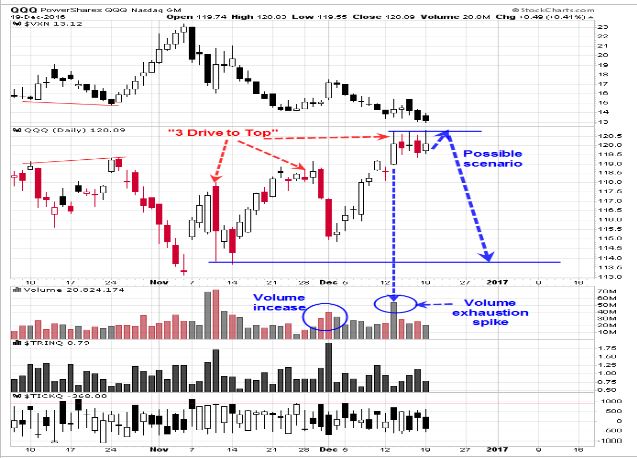
The pattern forming on QQQ appears to be a “Three Drives To Top”. To help identify this pattern, the second top should retrace over 61.8% of the previous rally on increased volume (check). There is a volume spike as the QQQ marked its third potential top and this spike in volume appears to represent exhaustion. Also, test of high volume highs usually represent resistance and today the high volume day was tested and back away. The Nasdaq McClellan Oscillator made a higher high today suggesting that another attempt to rally tomorrow is possible. “Three Drives to Top” have a downside target to where the pattern began and in this case would represent a pull back to the 114 range on the QQQ. If the QQQ pulls back so should the SPY. Neutral for now.
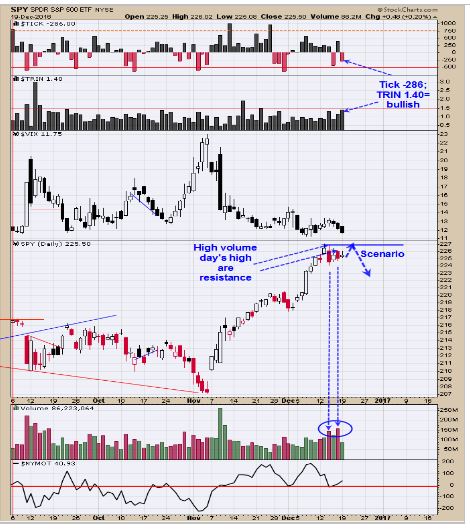
There where two volume spikes on the SPY, which occurred last Wednesday and Friday. The highs of these high volume days are resistance and so far neither has been tested but most likely will be tested soon. Today the TRIN closed at 1.40 and the Ticks closed at -286 which is a short term bullish combination suggesting tomorrow could be an up day. Also the McClellan Oscillator closed higher today, suggesting tomorrow could be higher. The QQQ could be building a short term high near current levels and there are some bearish signs on the SPY but signals are still incomplete. Still setting on our hands for now. Sold our long SPX position at 2253.28 for a gain of 2.48% on 12/15/16; Long SPX on 11/30/16 at 2198.81.
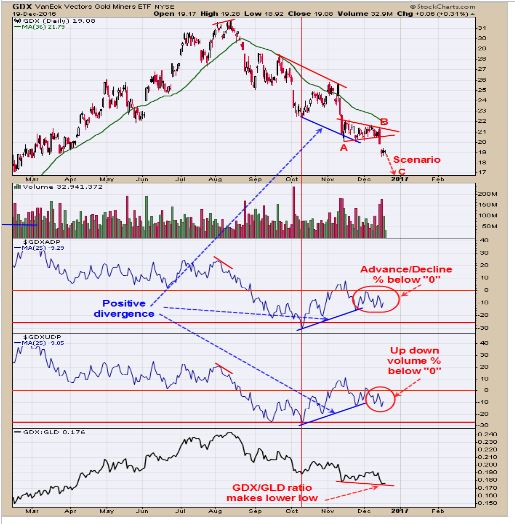
The trading range that began in mid-November and ended in Mid December could be a “B” wave which can mark the half way point of the move down and if it turns out to be the case this go around for GDX would give a target near 17.00 level. Both the Advance/Decline percent and Up down Volume Percent are showing a bullish divergence suggests a longer term bottom is approaching. However, both are still below “0” suggesting the downtrend is still ongoing. A close above “0” on both indicators will suggests a new uptrend has begun which happen back at the January low. There are bullish signs here but the bottom process is still incomplete. Still neutral for now.
Disclaimer: Signals are provided as general information only and are not investment recommendations. You are responsible for your own investment decisions. Past performance does not guarantee future ...
more

