
Nasdaq Composite: Will The March High Mark A Goodbye
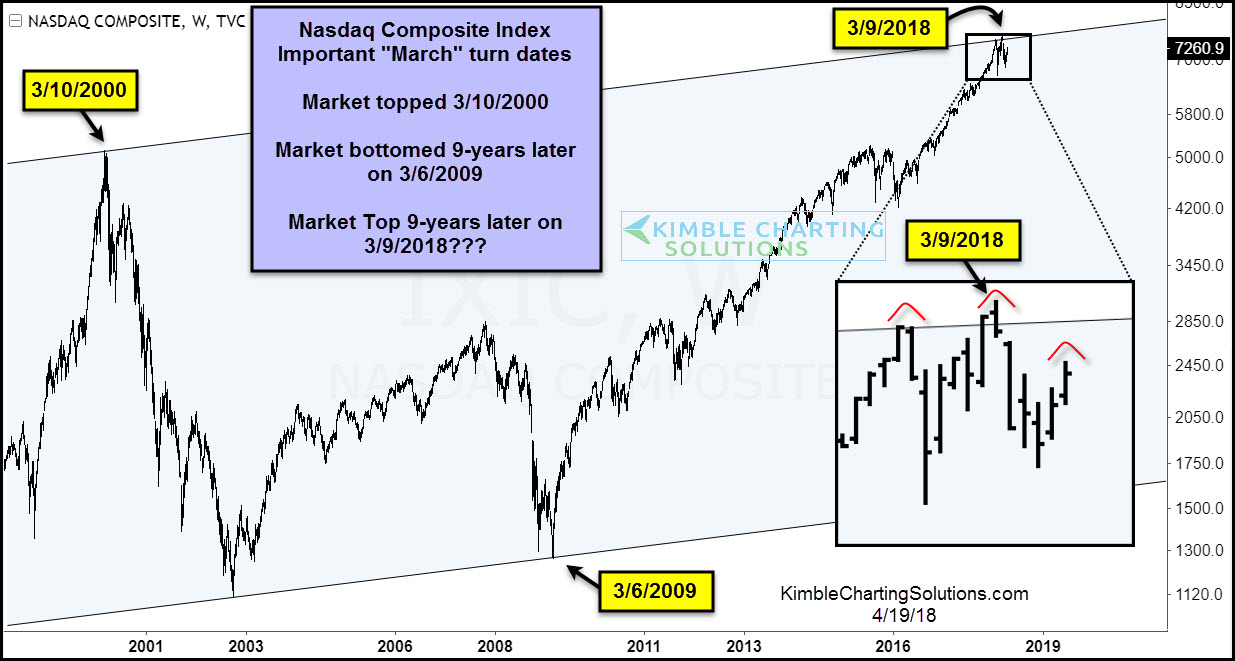
The month of March has produced some major turning points for the Nasdaq Composite over the last 20 years. The Nasdaq topped in March of 2000 and bottomed 9 years later in March 2009. Is it possible that 9 years after the major bottom, we put in a major top (March 2018).
In a recent article, I highlighted two major divergences that occurred at this year’s March highs: 1) The Nasdaq hit new highs, the S&P 500 and Dow Jones did not 2) The Nasdaq hit new price highs while its RSI (relative strength) indicator did not.
This also occurred at long-term channel resistance. And to make matters worse for tech investors, the Nasdaq Composite is forming a bearish head and shoulders pattern. The stars appear to be aligning for market bears once again. But it’s still early on. Will they take the control? Or let this opportunity pass them by? Stay tuned… and disciplined!
Nasdaq Composite Weekly Chart
(Click on image to enlarge)
Sign up for Chris's Kimble Charting Solutions' email alerts--click here.


