
Nasdaq Breadth Metrics Breakdown As Russell 2000 Cracks
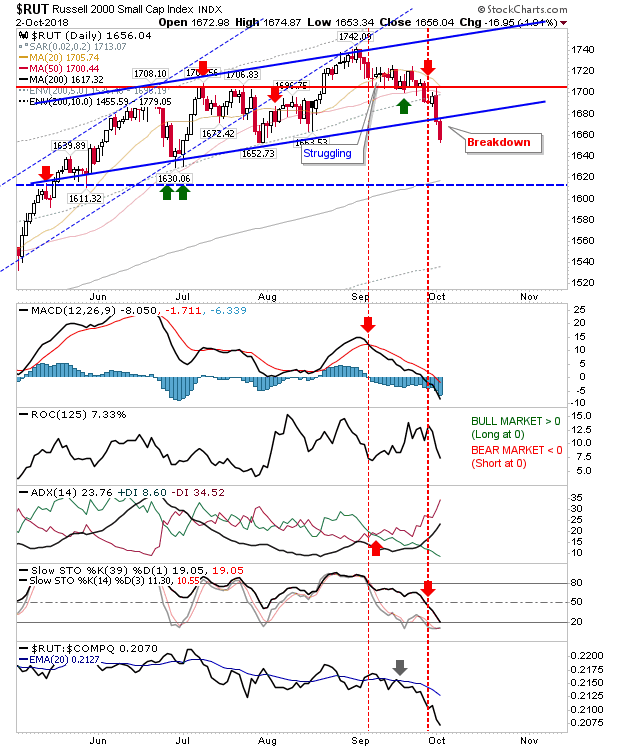
A mixed bag of events for markets as some moved while others remained unchanged. The Russell 2000 made a key move lower as it broke channel support. Relative performance widened its losses as declines were logged. The next target is the 200-day MA.
For the last six months, Nasdaq breadth metrics have consolidated into a triangle but this all changed today. The biggest change in the Nasdaq Bullish Percents was the well-marked breakdown on very weak technicals.
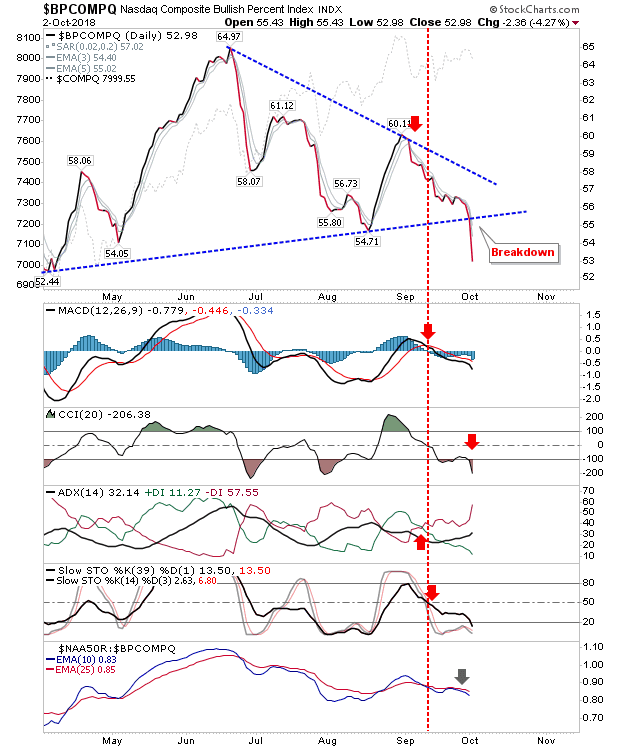
This weakness spread to other breadth metrics such as the Percentage of Nasdaq stocks above the 50-day MA and Summation Index.


What this means for the Nasdaq is troublesome. The index broke channel support and has bumped along just beneath this support. Today also saw a MACD trigger 'sell' and an On-Balance-Volume 'sell'. The aforementioned Nasdaq breadth metrics suggest this index is heading lower.

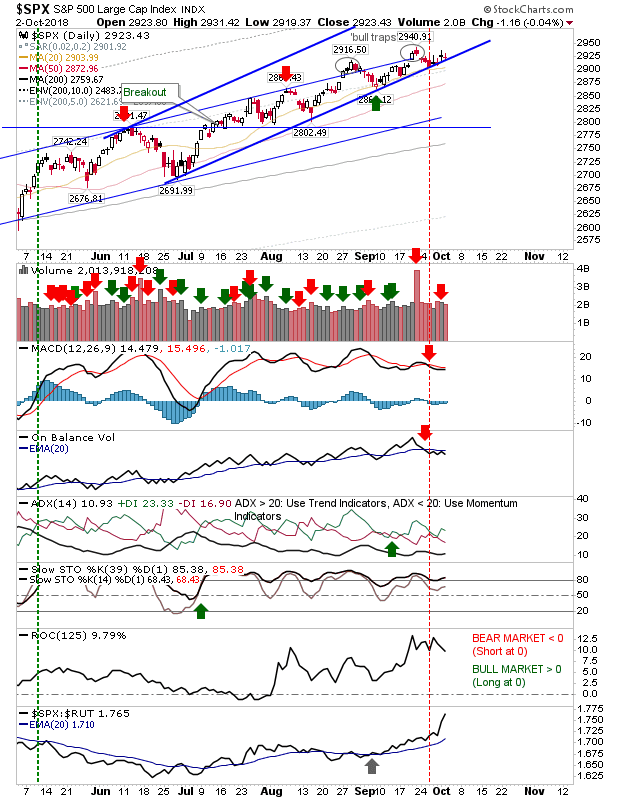
The S&P didn't do a whole lot today; the narrow range doji held support for another day but with the Russell 2000 and Nasdaq under pressure, the chances of it following suit lower are quite high.
The index bucking the trend is the Dow Jones Industrial Average. Today's gain effectively negated the bearish evening star as it continues to move towards channel resistance.

For tomorrow, watch for an acceleration lower in the Russell 2000 and Nasdaq, as the Dow Jones Industrials looks again to diverge (and in the process make relative performance gains) from its peers. From a new trade perspective, a swing trade in the S&P; buy a break of doji high's or sell a loss of its lows with a stop on the doji flip side, looks reasonable given the emerging volatility.


