
Myriad Of Signs
In yesterday’s alert we emphasized that the breakdown in the USD Index should not be trusted as it was not confirmed and there were several good reasons to think that it would not be confirmed. The breakdown is already invalidated and – again, as discussed yesterday – this is actually a strong bullish sign. Is the decline in the USD Index over and is the big slide in the precious metals sector just around the corner?
In short, that seems quite likely. Naturally, there’s much more to the precious metals market than just the USD Index and it’s prudent to analyze more factors than just this specific index. In other words, it is of utmost importance especially at this time, but there are many other important signs to keep in mind. Still, let’s start today’s analysis with the U.S. currency (charts courtesy of http://stockcharts.com).
(Click on image to enlarge)
In yesterday’s alert, we commented on the above chart in the following way:
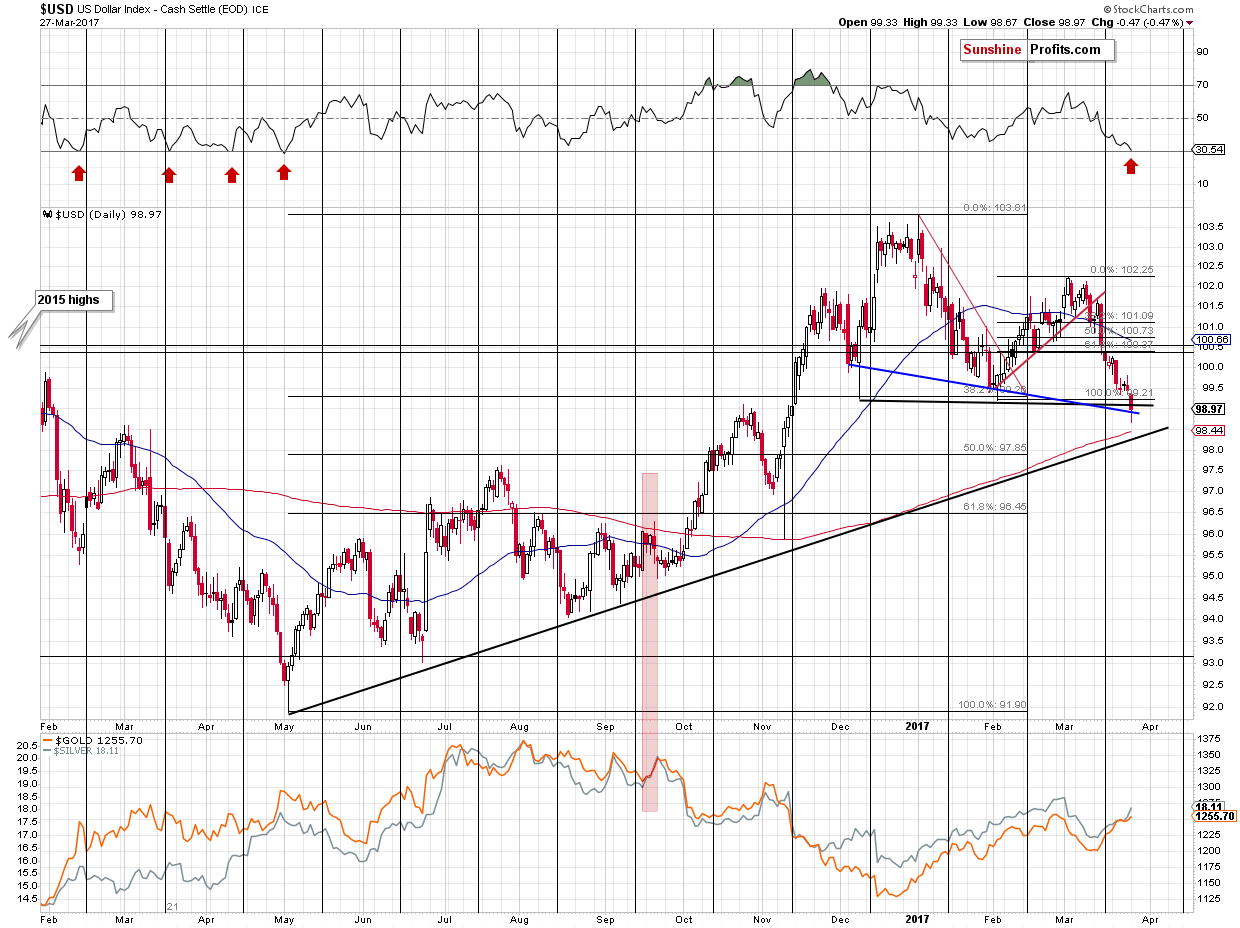
Today’s move to 99 is a small breakdown below the previous lows. Because the move is relatively small and the session in the U.S. is far from being over, it is definitely not confirmed. In fact, it could be quickly erased and the supposedly bearish event could turn into an invalidation of the breakdown, which would be a very bullish sign. For now, today’s move is not something that changes the short-term outlook.
Based on the above chart, the USD Index reversed and closed the session at 98.97 – there reversal is visible, but the breakdown was not really invalidated. However, if we take the closing price from Bloomberg – 99.166, we see that the USD Index closed extremely close to its February low (99.19). Still, no invalidation of the breakdown, but we now see that the breakdown was indeed very tiny. How much does it matter as of this moment? At this moment, the USD Index is trading at 99.21, having earlier moved to 99.347. This means that however one chooses to interpret yesterday’s breakdown or the daily reversal, the breakdown was still invalidated today and the bullish implications are in place anyway.
Additionally, if we focus on daily closing prices alone, then one can argue that there was actually no breakdown at all – the USD Index closed above the declining support line based on the daily closing prices (marked in blue). Either way, the implications of yesterday’s session are not bearish, but bullish.
The RSI indicator has just flashed / is about to flash a major buy signal as it moved to the 30 level. It didn’t move below it, but its proximity seems to be enough to be viewed as a buying opportunity. As you can see on the above chart, the last time when we saw this signal, the USD Index formed a major bottom in early May 2016. This signal also corresponded to a few local bottoms earlier that year.
The outlook for the USD Index is bullish, which has bearish implications for the precious metals market, especially that the latter is responding to the USD’s signals with much smaller strength than one might expect – the USD Index is well below its February monthly close, while gold and silver are relatively close to their own respective February closes. The USD Index’s long-term outlook and its implications for precious metals are even more important than the short-term one and our recent alerts include details. Having said that, let’s move to gold.
(Click on image to enlarge)
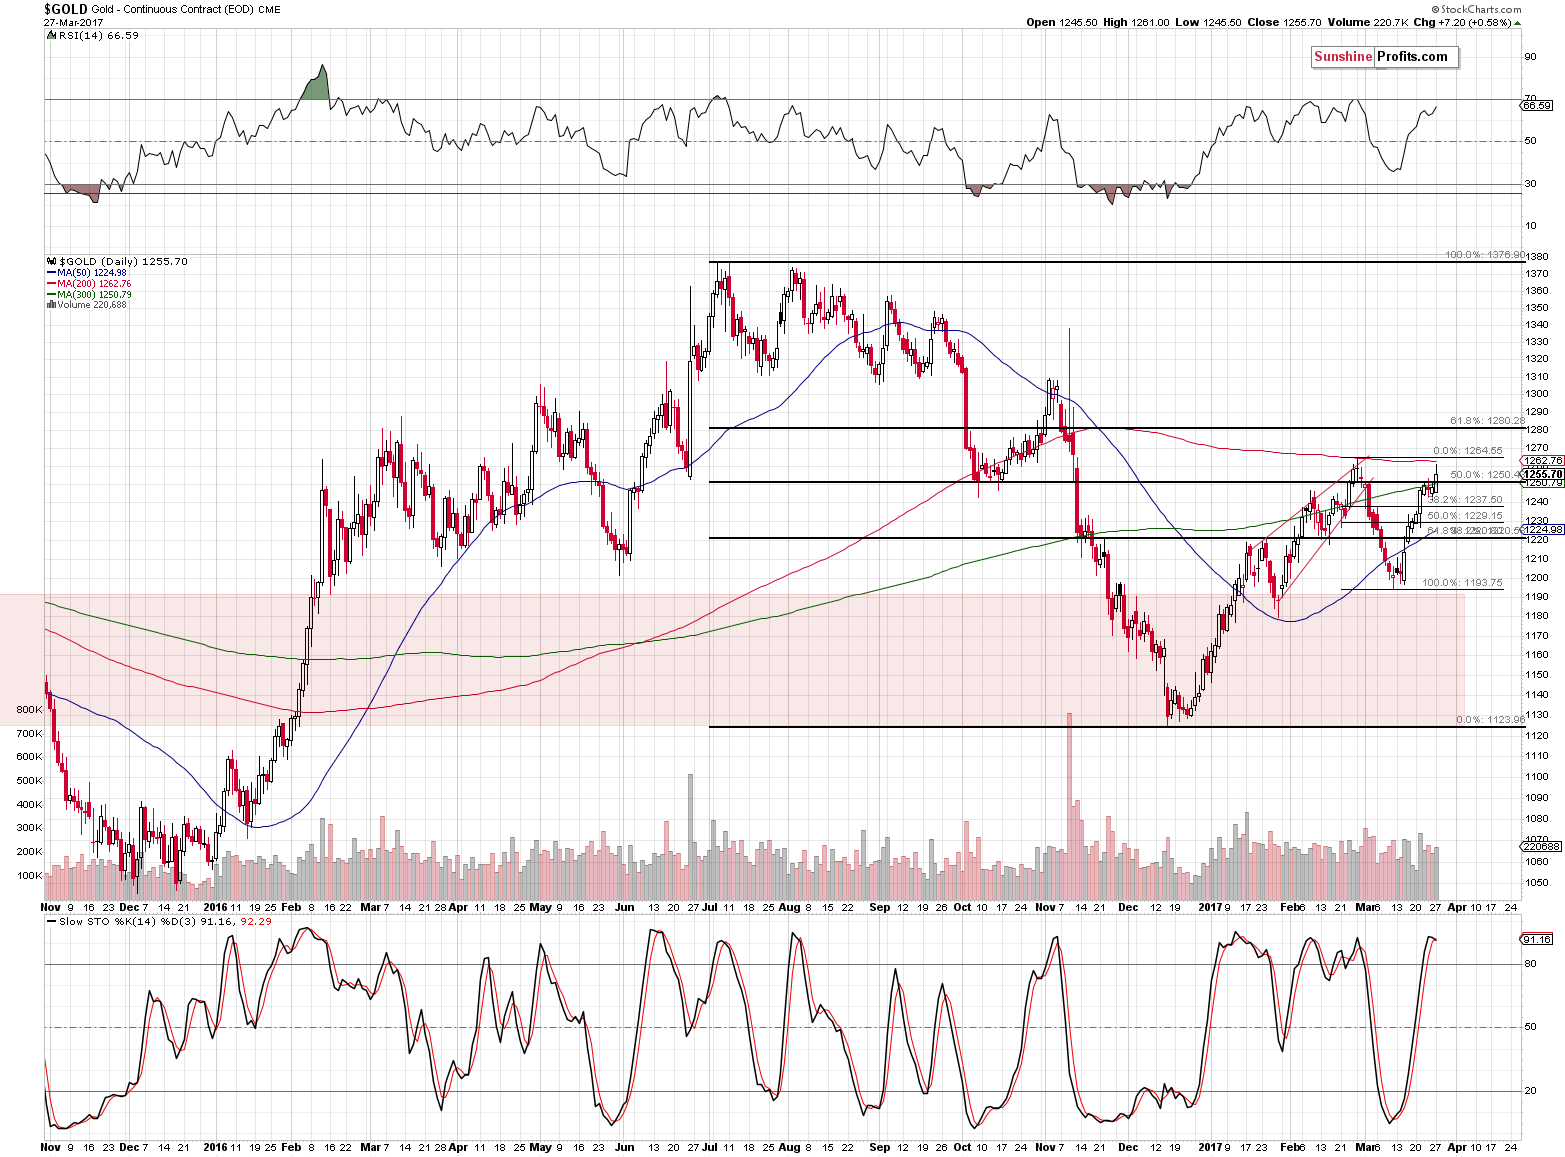
Just as the USD Index reversed yesterday, before the end of the session, gold did the same thing. As we discussed yesterday, gold moved to its February high and the 200-day moving average. Both are strong resistance levels and their combination is even stronger. Will it be enough to stop gold’s rally? It’s quite likely, especially that the volume on which gold moved higher on Friday was relatively low and this move was accompanied by silver’s outperformance (the white metal tends to outperform in the final parts of an upswing).
Gold’s volume that we saw yesterday wasn’t low, but that’s not what’s expected during reversals and thus it’s not necessarily a bullish phenomenon. Gold touched, but didn’t break the mentioned combination of resistance levels and – given the situation in the USD Index and also other factors – it’s not likely to break it or confirm such a breakout. There is a small sell signal from the Stochastic indicator, but it’s not one of the most important signals.
The mentioned outperformance of the white metal is.
(Click on image to enlarge)
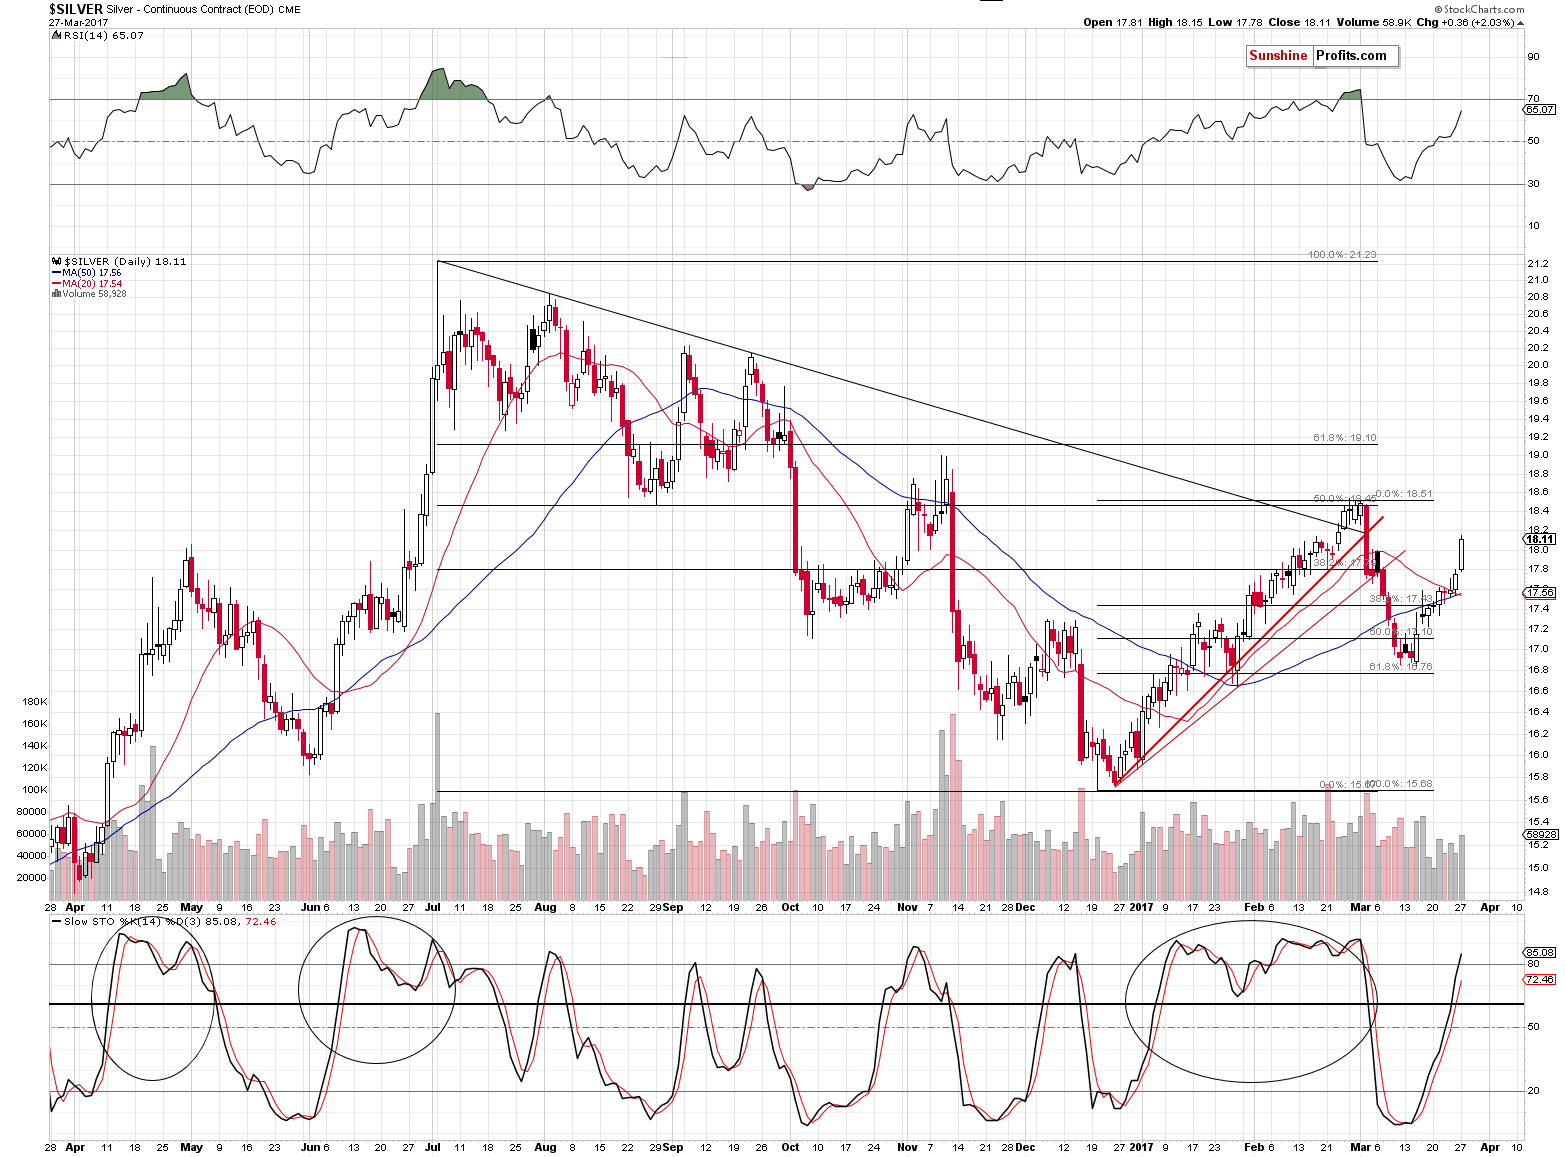
In the past years, there were numerous times when silver faked a rally, breakout or even outperformed just on an intra-day basis right before turning south. Why is this the case? There is no way to say with 100% certainty why a given move has really happened, but it’s quite likely related to the fact that the silver market is much smaller than the one for gold and thus the share of individual investors compared to the share of big, institutional (professional) investors is much bigger.
One of the lesser known gold trading tips is that the general public is usually most eager to buy close to tops and thus we see that silver (to a bigger extent driven by these investors) outperforms gold right before tops. This is not always the case and doesn’t have to be the case, but it very often is – often enough to view silver’s outperformance (especially when accompanied by mining stocks’ underperformance) as something important and bearish.
Speaking of mining stocks’ underperformance, let’s take a look at the GDX.
(Click on image to enlarge)
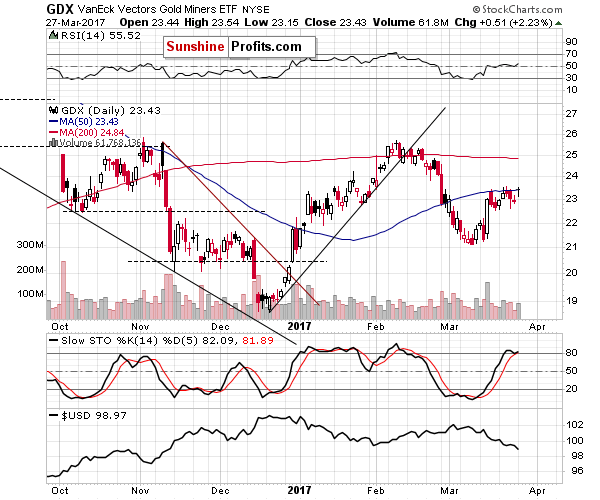
Mining stocks are not following gold higher. GDX closed at its 50-day moving average, unable to generate a visible rally even though gold and silver moved visibly higher. Miners simply moved to last week’s high – not above it. Moreover, please note that mining stocks are not even close to their February highs, which proves that their underperformance is not only a one-day event.
We may have a good opportunity to re-enter the short position at higher prices, but if the risk/reward ratio suggests opening long prices, we'll likely proceed as well. We will be monitoring the ...
more

