
Moving Averages In Extended Market Climates
As you know I tend to use the 50-day average a lot when it comes to charting and managing an overall uptrend as the 50 day tends to act as a trailing support zone when an issue or index is above it during pullbacks. However, there comes a time where markets get extended away from the 50-day average. That's where shorter-term moving averages come into play. This past weekend in the premium newsletter I added those moving averages to the daily index charts and felt it was too good not to share with you people so here is an excerpt.
Keep in mind when dealing with the 10 and 20-day averages they are what I like to call moving averages for use in accelerated up trending markets. I'm not a big fan of using them as they tend to burn themselves out rather fast to the upside when an issue or the market turns which in turn makes them prone to breaks to the downside a lot faster than the 50-day average. Not to mention they tend to whipsaw one quite a bit (mostly the 10 day) and really don't allow for that much wiggle room. Take a look at BOTZ here for a moment and you'll see what I mean.
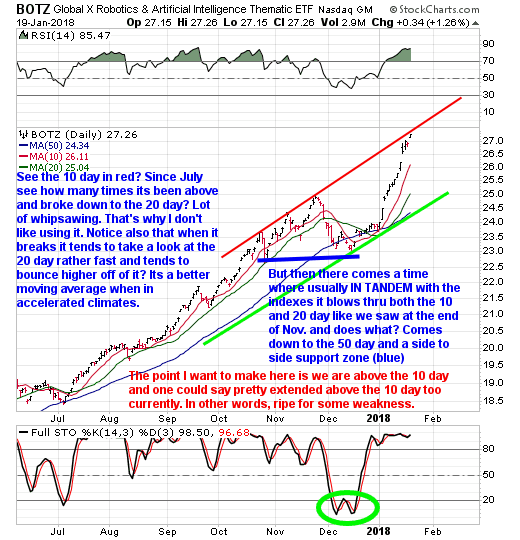
Also of note while I'm at it notice where BOTZ is currently bumping its head upon? If you said trend channel resistance (red) you are correct and that alone ought to tell you something about it and anything that looks like it with regards to any further meaningful upside from here.
Another way to look at shorter-term moving averages like the 10-day and 20 day is to think of them as being on an airplane right after take off. Let's start with the 10-day average. Think of an issue trading off the 10- day as the initial get off the ground and get to an altitude of say 5000 feet. The angle of ascent is much steeper and faster. Of course, it depends upon the pilot. I say that as I've been on flights where its as if the commercial pilot is reliving his fighter jet days.
Then shortly thereafter the angle of altitude climb tends to level off as you move thru 5000 to 20,000 ft. let's say. Think of that as now trading off the 20-day average. Still climbing but leveling off more so than when trading off the 10 day.
After that here too the angle of altitude climb levels off even more which when applied to moving averages can be construed as approaching cruising altitude. Think of that as now trading off the 50-day average and just cruising.
Look at issues that are trading off the 50-day average as at cruising altitude which let us say is akin to owning a stock in a big picture overall up trending channel and trading off the 50-day. Of course, as we all know after being at cruising altitude there comes a time where we start approaching our destination and start making a descent. Which, in this analogy, is when an issue that is above the 50-day and in an overall uptrend that starts to go into a correction and break its 50-day average and its overall uptrend.
Take a look at IPGP here as it too gives you a good idea as to why I don't like to use the 10-day average as a trailing stop due to too many whipsaws vs the 20-day average generally speaking.
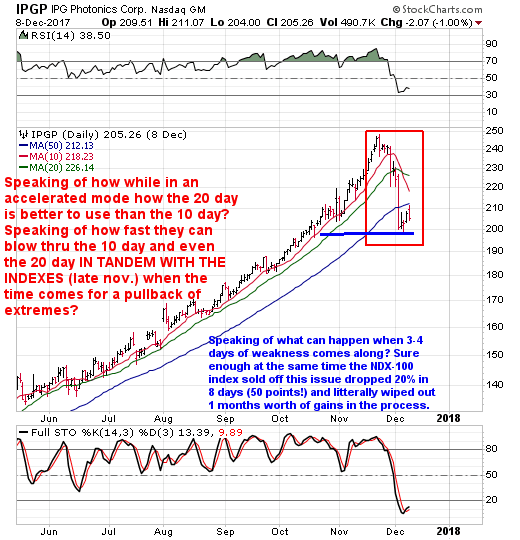
As you can see up thru late November one could say it was trading off the 10 and 20-day average. Notice how many times it would break below the 10-day average by a smidge and recapture it fast? That's why the 20 day is better to use when one owns an issue in an accelerated up trending market. It allows for less false breaks that can whipsaw one out of an issue unnecessarily. But when the market decides to stage a healthy pullback? Notice how fast a stock or an index for that matter can blow right thru the 10 and 20-day average? Just another reason why they are better used for when we get in an accelerated market climate when it comes to managing trailing stops.
If you've ever head the phrase "Trial And Scale" this is one way one can use a shorter term moving average to help you to trail a stop in an accelerated market climate.
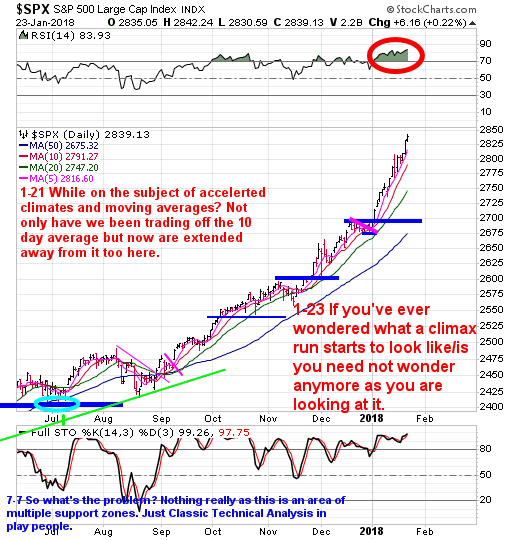
When we apply all of the above educational content to the SPX? It doesn't take a rocket scientist to see we are now not only above 10-day average but now extended above it as well.
Lastly, if you have ever wondered what a CLIMAX RUN Looks Like/Is you need not wonder anymore because there is a strong possibility that you are looking at it taking place.
Remember, the sun is always brightest at its peak you know and it sure is looking pretty bright right now for a guy like Greedy Gus is you ask me.
Disclosure: None.
Disclaimer: THESE ARE NOT BUY RECOMMENDATIONS! Comments contained in the body of this report are technical opinions only. The material herein has been obtained from sources ...
more

